Ethereum (ETH) is hovering above $2,000 as we approach the end of March, with traders watching whether it can close its first positive month since August 2025.
The outcome is important because a sustained break above or below key levels could determine whether the altcoin comes out of a prolonged slump or extends it further.
ETH Testing $2K
The world’s second-largest cryptocurrency has ended up in the red in each of the last six months, and data shared on March 30 by analyst Wise Crypto shows cumulative dips nearing 50%. Furthermore, its price action has stayed trapped in a falling channel since mid-March, and whale holdings have dropped significantly, with the analyst noting that these large holders had sold around 180,000 ETH.
Meanwhile, fellow market watcher Markus Thielen pointed to mixed technical signals, with ETH recently breaking below a key support structure and forming what he described as a bear flag pattern. He said that there had been a similar formation in January, which came right before ETH dropped below $1,800, raising concerns that the current setup could follow the same path.
There has also been limited demand for the asset, with trading volumes subdued and the last green day for ETF flows appearing on March 17, which has been followed by 8 straight days of outflows per data from SoSoValue, pushing their performance so far this month to -$82.13 million.
But Wise Crypto says that $1,970 is now the decisive level, warning that a breakdown could open the path toward $1,910, $1,830, and even $1,650. However, a move back above $2,050 could provide some relief for ETH. That last outlook is similar to what Ted Pillows shared last week when he wrote that ETH could rebound to a liquidity cluster around $2,100 before resuming a downtrend.
Data from CoinGecko shows ETH trading near $2,040 at the time of writing, up by about 2% in the last 24 hours but remaining pretty flat over the past week. Nevertheless, the token was down more than 10% across 14 days, although it gained approximately 6% in the previous month.
Ethereum and BTC in the Same Boat
Going back to Ethereum’s performance since last year, CryptoRank data shows that although the asset registered strong gains in May (+41.1%), July (+48.7%), and August 2025 (+18.7%), it all went downhill after that. ETH has since posted negative monthly returns from September last year up to February this year, with the worst performance of that period coming in November 2025, when returns dipped by over 22%.
After a rather flat December, the pain resumed in January 2026, when ETH fell 17.7%, repeating the trick in February with another 19.6%. However, March has so far produced a positive return, standing at just under 5% at the time of writing. Still, with today and tomorrow to go, and price stability not assured, that gain is not yet secure.
Bitcoin (BTC) is also looking for a first positive return since October 2025, although the OG crypto is cutting it even closer with returns at less than 1%, according to CoinGlass, after losing nearly 15% in February and slightly over 10% in January.
A March 30 update shared by XWIN Research Japan suggested that BTC’s current market closely resembles a “demand pause” rather than a full capitulation, with the asset’s SOPR metric, which measures whether coins are being sold at a profit or loss, hovering near the break-even level.
That framing may also apply to Ethereum. The structural pieces, including the ETF vehicles, the institutional frameworks, and the DeFi rails, are still in place. But what is missing is the buying pressure to put them to use, and whether the next couple of sessions around the $1,970 level provide a catalyst in either direction is something traders will be watching closely before the March monthly candle closes.
The Hyperliquid price prediction anticipates a high of $58.45 by the end of 2026.
In 2029, it will range between $136.37 and $155.85, with an average price of $146.11.
In 2032, it will range between $233.78 and $253.26, with an average price of $243.52.
Hyperliquid is a leading decentralized exchange (DEX). It has its own Layer 1 blockchain, and HYPE is its native token, which is used for staking, governance, and payments within the ecosystem.
One of the key features of Hyperliquid, along with its high-speed platform, is that it offers crypto perpetual futures for trading by its users without the need to own the asset. The platform supports a number of cryptocurrencies, including but not limited to BTC, ETH, SUI, AVAX, and SOL, to name a few.
Technically, the Hyperliquid blockchain is based on two protocols, namely HyperEVM and HyperBFT; combined, they help provide high-speed trading and Ethereum-based smart contracts with reliability to support the Hyperliquid ecosystem.
The Hyperliquid platform revolves around community participation, as token holders have voting rights to govern and influence developments taking place on the platform.
On November 29, 2024, Hyperliquid conducted an airdrop of its native token, HYPE, but unlike other players, it was selective in allocating the airdrop to only 94,000 users with an average value of $45,000 to $50,000, making it one of the most worthy airdrops in crypto history.
Let’s take a deep dive into what the future holds for the HYPE token in Cryptopolitan’s Hyperliquid price prediction for 2026 and beyond.
Overview
Cryptocurrency
Hyperliquid
Token
HYPE
Price
$38.41 (-1.44%)
Market Cap
$9.85B
Trading Volume
$260.05M
Circulating Supply
256.39M HYPE
All-time High
$59.30 (Sep 18, 2025)
All-time Low
$3.2 (Nov 29, 2024)
24-hour High
$39.32
24-hour Low
$38.08
Hyperliquid Price Prediction: Technical Analysis
Metric
Value
Price Prediction
$28.87 (-24.77%)
Price Volatility (30-day variation)
12.63%
50-Day SMA
$33.47
200-Day SMA
$34.22
Market Sentiment
Bullish
Fear & Greed Index
13 (Extreme Fear)
Green Days
17/30 (57%)
Hyperliquid Price Analysis
TL;DR Breakdown:
Hyperliquid price analysis confirms a downward trend at $38.41.
Cryptocurrency has lost 1.44% of its value.
HYPE token faces strong resistance around the $43.29 range.
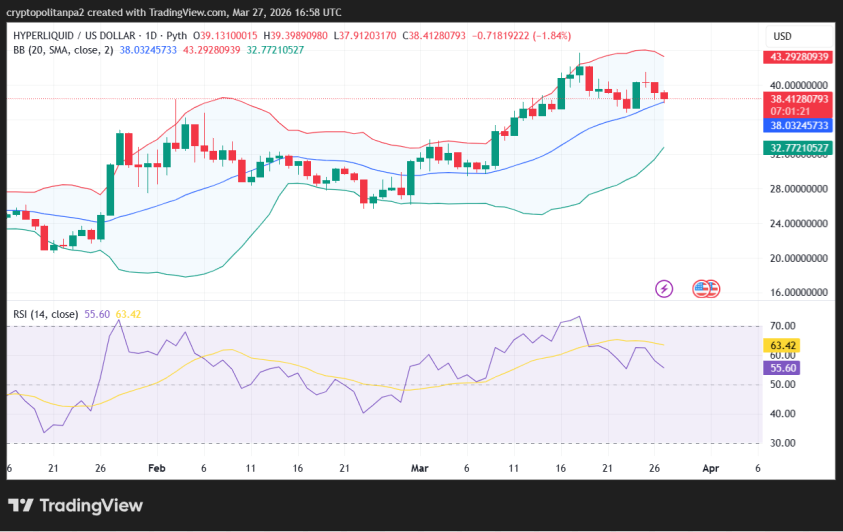
On March 27, 2026, Hyperliquid price analysis revealed a downward trend for the altcoin. The coin is trading at $38.41 after finding resistance at $40.36. From an overall perspective, the currency lost a significant 1.44% in its value in the last 24 hours. The decrease creates relatively unfavorable circumstances for investors, as the altcoin is now shedding value. However, market conditions appear risky, as the token may continue to correct following the recent dip.
HYPE/USDT 1-day chart analysis
The one-day price chart of Hyperliquid Coin confirmed a bearish trend in the market. The cryptocurrency’s value decreased to $38.41 during the day, as bears strive to suppress the price further. At the same time, a red candlestick on the price chart signifies the presence of bearish elements. Sellers are leading the price action, as the coin is losing value as a result of the return of the bearish trend.
The distance between the Bollinger Bands defines the level of volatility. This distance is wide, leading to high volatility levels, as the bands are expanded. Moreover, the upper limit of the Bollinger Bands indicator, indicating resistance, has shifted to $43. Conversely, its lower limit, indicating support, has moved to $32.
The Relative Strength Index (RSI) indicator is trending in the neutral region. The indicator’s score has decreased to 55 today. This condition is reflected by a downward-pointing RSI curve. If selling activities continue to intensify, the indicator’s reading can decrease further towards the index 50.
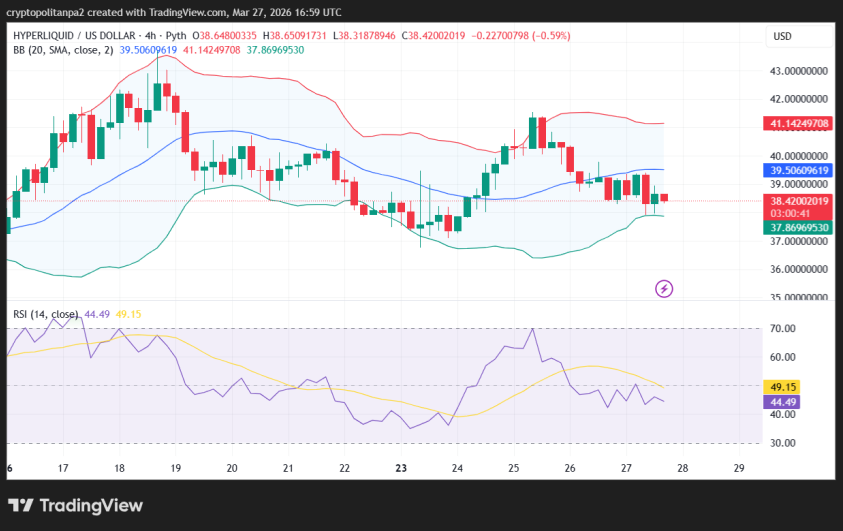
HYPE/USDT 4-hour chart analysis
The four-hour price analysis of Hyperliquid also indicates negative sentiment in the market. The HYPE/USD price has decreased to $38.42 over the past few hours as selling pressure returns. The increasing volatility also suggests a high probability of an imminent reversal or further price depreciation.
The Bollinger Bands have slightly diverged as the distance between them has increased, resulting in high volatility levels. This condition typically signifies more market unpredictability. Technically, the upper Bollinger Band has shifted to $41, indicating a resistance level. Conversely, the lower Bollinger Band has moved to $37, indicating a strong zone of support.
The RSI indicator is trending in the neutral region for now. The indicator’s value has decreased to 44 in the last four hours. Overall, selling activity remained high during the last four hours of the day, which has resulted in a decrease in the indicator’s score.
Hyperliquid Technical Indicators: Levels and Action
Daily simple moving average (SMA)
Period
Value ($)
Action
SMA 3
35.63
BUY
SMA 5
36.06
BUY
SMA 10
38.13
BUY
SMA 21
36.65
BUY
SMA 50
33.47
BUY
SMA 100
29.91
BUY
SMA 200
34.22
BUY
Daily exponential moving average (EMA)
Period
Value ($)
Action
EMA 3
36.01
BUY
EMA 5
34.01
BUY
EMA 10
31.26
BUY
EMA 21
29.10
BUY
EMA 50
29.76
BUY
EMA 100
32.98
BUY
EMA 200
34.79
BUY
What to expect from Hyperliquid price analysis?
Hyperliquid price analysis gives a bearish prediction regarding ongoing market events. The coin’s value decreased to $38.41 in the past 24 hours, as it is receiving negative sentiment today. According to an overall analysis, the currency lost 1.44% in its value today. Technical indicators give bullish signals, but the price charts showcase a bearish market scenario at the time of writing.
Why is Hyperliquid down?
The cryptocurrency market is showing negative trends, and HYPE is receiving the same sentiment. Moreover, it is encouraging that HYPE marked a new ATH a few months ago, on September 18, 2025. However, from a broader perspective, the HYPE price decreased to $38.41, losing 1.44% in its total value today.
Is Hyperliquid a Good Investment?
HYPE has growing utility, and its Ethereum compatibility helps it steal a share of DeFi industry. While the technical analysis can change from bullish to bearish, price predictions paint a different picture. However, a risk analysis is recommended.
Will Hyperliquid reach $50?
The current price action does justify predicting a $50 target. In the cryptocurrency market, things change rapidly, but if the token maintains its price levels, a rally can be initiated. It can be expected that HYPE will reach above $50 by any time in 2026 once again, as it did in September and October.
Can Hyperliquid Coin reach $100?
According to Hyperliquid price prediction, HYPE price might surpass $100 in 2028. The highest price HYPE could attain that year is expected to be above $123.38.
Will Hyperliquid reach $500?
According to crypto analysts’ price predictions, Hyperliquid may not reach this level in the next five years. Considering the current market cap of the token, it seems like far target.
Will Hyperliquid reach $1000?
Per the Cryptopolitan’s HYPE price prediction, Hyperliquid is unlikely to reach $1000 before 2032.
How high can Hyperliquid go?
The highest expected price for Hyperliquid is $253.26, which it will achieve in 2032.
Does Hyperliquid have a good long-term future?
Hyperliquid is trading higher than its December 2025 price levels, making it an ideal time for buyers to enter the market. Given its current price and a favorable future valuation of $253.26 by the end of 2032, the asset appears to be a worthwhile investment.
Recent News/Opinions on Hyperliquid
Cryptopolitan reported that Hyperliquid is now offering Brent and WTI futures. The oil trades are available through the HIP-3 framework on the XYZ exchange, as traders bet high on oil as it smashed through $100 for the first time in years. It is important to remember that XYZ:CL, representing WTI oil, entered the top 5 of the most traded futures in the past week.
The Hyper Foundation announced that it will contribute 1 million hype tokens to support the creation of the Hyperliquid Policy Center. The Foundation said the policy center will have a positive impact in favor of clear regulations for decentralized finance.
The Hyper Foundation will contribute 1M HYPE tokens to support the creation of the Hyperliquid Policy Center.
The tokens will be unstaked later today. The Hyperliquid community will benefit from having representation in Washington, D.C., and we are confident that under… https://t.co/Vgo95Nrr17
This month, Hyperliquid is expected to reach a high of $40.48, with an average price of $29.32 and a minimum trading price of $19.78.
Hyperliquid Price Prediction
Minimum price
Average price
Maximum price
Hyperliquid price prediction March 2026
$19.78
$29.32
$40.48
Hyperliquid Price Prediction 2026
The price of HYPE is predicted to reach a minimum value of $14.31 in 2026. Traders can anticipate a maximum value of $58.45 and an average trading price of $48.70 throughout this year.
HYPE Price Prediction
Minimum price
Average price
Maximum price
Hyperliquid price prediction 2026
$14.31
$48.70
$58.45
Hyperliquid Price Predictions 2027 – 2032
Year
Potential Low ($)
Potential Average ($)
Potential High ($)
2027
71.43
81.17
90.91
2028
103.90
113.64
123.38
2029
136.37
146.11
155.85
2030
168.84
178.58
188.32
2031
201.31
211.05
220.79
2032
233.78
243.52
253.26
Hyperliquid (HYPE) price prediction 2027
The year 2027 will experience more bullish momentum. According to the Hyperliquid price prediction, it will range between $71.43 and $90.91, with an average trading price of $81.17.
Hyperliquid crypto price prediction 2028
The Hyperliquid price prediction climbs even higher into 2028. According to the projections, the price of HYPE will range between $103.90 and $123.38, with an average of $113.64.
Hyperliquid coin price prediction 2029
According to our Hyperliquid (HYPE) price prediction for 2029, we expect a maximum price of $155.85, a minimum price of $136.37, and an average price of $146.11.
Hyperliquid price prediction 2030
As per the HYPE price prediction for 2030, it will reach a maximum price of $188.32 and a minimum price of $168.84, with an average price of $178.58.
Hyperliquid price prediction 2031
The Hyperliquid forecast for 2031 suggests a price range of $201.31 to $220.79 and an expected average trading price of $211.05. This long-term prediction also hinges on HYPE’s rising global recognition and adoption.
Hyperliquid prediction 2032
The Hyperliquid price forecast for 2032 is a high of $253.26. According to the HYPE coin price prediction, it will reach a minimum price of $233.78 and average at $243.52.
While the short-term sentiment keeps flickering, we anticipate Hyperliquid will trade higher in the coming years. The coin will achieve a high of $58.45 before the end of 2026. In 2027, it will range between $71.43 and $90.91, with an average of $81.17. However, you should note that HYPE is still quite volatile. Negative market sentiment, such as market crashes, could derail the predictions.
The native token of Hyperliquid, called HYPE, was launched on November 29, 2024, through an airdrop targeted at a limited number of only 94,000 users.
This was one of the most lucrative airdrops, with an average allocation of value of $45,000 to $50,000.
Hyperliquid kept away from venture capitalists, who usually get most of the tokens in usual airdrops; rather, 76% of the supply was slated for user-centric initiatives.
Usually, tokens dump after airdrops until the market momentum picks up, but Hyperliquid’s approach helped garner trust, and the token jumped from $4 to $35 from November 2024 to December 22, 2024.
Hyperliquid’s market cap improved during this period, reaching above $8 billion, showing significant growth, as it received super positive market sentiment.
In late December and early January 2025, the HYPE token corrected down to $20.24, shedding significant value as per crypto market data.
Price stabilized through February as it traded in a range of $19.92 to $27.42 before taking a dive at the end of February, when the broader trend turned bearish again.
HYPE stumbled to $12.34 by mid-March, and it touched a low of $10.21 on April 7, 2025, which significantly decreased the market capitalization.
The token saw nothing but improvement in the remainder of the month of April, and its price surged to $18.57 by the end of the month.
On June 16, 2025, HYPE reached a high price of $45.57. A month later, on July 14, it marked another all-time high of $49.75, and on August 27, it discovered the $50.99 level with changing market dynamics.
On September 18, HYPE achieved its ATH at $59.30, and in October, it corrected to $50. At the start of December, the HYPE token price fell to the $31 range.
At the start of 2026, the HYPE token was trending near $25, and in March, it increased to the $33 range, with the broader crypto market still in bearish mode.
Bitcoin’s consolidation near $76,000 following a sharp rally from $70,292 presents institutional traders with a critical technical juncture that will likely determine the asset’s near-term directional bias. A decisive break above $75,500 resistance could unlock additional upside toward $78,000, while failure to hold support at $72,000 risks exposing weakness back toward $71,200. The rangebound price action reflects typical post-surge caution, but the underlying technical structure suggests accumulation at lower levels and building momentum for a potential breakout.
Bitcoin’s recent advance to nearly $76,000 demonstrates sustained institutional interest in the flagship cryptocurrency, yet the current consolidation pattern indicates traders are reassessing conviction at key resistance levels. The technical setup presents a binary outcome that will likely define market direction over the coming sessions. The rally that lifted Bitcoin from a swing low of $70,292 to a session peak of $75,998 has stalled in a critical resistance zone, creating a well-defined trading range that institutional participants are carefully monitoring. Current price action reflects typical post-surge consolidation behavior, with Bitcoin trading above the 100-hour simple moving average and maintaining support in the $73,500 region. This intermediate positioning suggests neither aggressive buyers nor determined sellers have achieved dominance, leaving the market susceptible to sharp directional moves pending clarity at key technical levels.
Technical Setup: Consolidation at Critical Resistance
Bitcoin’s price structure over the past trading sessions has established a textbook consolidation pattern following the advance from $70,292. The current zone near $75,000 represents a natural resting point where profit-taking and resistance convergence have temporarily halted the rally’s momentum. The Relative Strength Index remains above 50, indicating moderate upward momentum remains intact, though the hourly MACD is displaying signs of deceleration within bullish territory—a potential early warning signal for exhaustion if price action fails to break decisively above resistance. This technical divergence between momentum indicators and price suggests the market is at an inflection point where conviction must be re-established to sustain higher prices.
A bullish trend line has formed on the hourly chart with a floor at $72,000, suggesting underlying accumulation is occurring at lower levels within the consolidation range. This technical support structure is particularly noteworthy for institutional traders, as it indicates that dip-buying remains present and the advance from the swing low has not lost structural integrity. The 50% Fibonacci retracement of the entire move from $70,292 to $75,998 sits at $73,150, creating a secondary support level that would likely attract institutional buyers should prices pull back further. The presence of this multi-layered support architecture suggests that downside risk is somewhat contained, at least until the $72,000 trend line is violated.
The upside technical scenario remains compelling for bullish traders. A decisive break above the $75,500 resistance zone would likely catalyze accelerated buying and establish $76,200 as the next immediate objective. Should momentum persist, successive targets of $77,500 and $78,000 represent realistic price extensions for sustained bulls. This upside thesis maintains validity as long as Bitcoin preserves support at the $73,150 Fibonacci level, which would indicate that the foundational structure of the rally remains intact. The path to higher prices exists, but requires confirmation through a close above $75,500 that demonstrates renewed institutional conviction and buying commitment.
Downside Risks and Critical Support Levels
The downside case becomes increasingly relevant if Bitcoin fails to maintain conviction at current levels and breaks below the $75,000 barrier. In this scenario, immediate support would materialize at $73,800, which represents the first line of defense for bulls. Should selling pressure intensify beyond this point, the critical $73,150 Fibonacci retracement level would represent the next meaningful support zone where institutional accumulation would likely emerge. The distinction between temporary pullback and meaningful breakdown hinges on whether Bitcoin can stabilize and defend this mid-range support area or whether selling momentum builds beyond institutional absorption capacity.
A break below the $72,000 bullish trend line support would extend losses considerably and expose the $71,650 level, with the original swing low near $71,200 representing the ultimate capitulation point for this rally structure. The psychological and technical significance of the $72,000 trend line cannot be overstated—its breach would signal that the underlying bullish structure has deteriorated and that accumulation at lower levels may be necessary before sustained upside resumes. Historical institutional behavior suggests that significant accumulation would likely emerge around the $71,200 level, where the recent swing low established proven buyer interest and represents a logical zone for portfolio repositioning and accumulation by large accounts.
The technical setup’s critical characteristic is that neither buyers nor sellers have demonstrated overwhelming commitment at current price levels. This lack of decisiveness leaves the market structurally vulnerable to sharp directional moves in either direction, pending a close above or below the $75,500 pivot level. For risk management purposes, institutional traders are likely employing tight stop-loss strategies around the $72,000 support level on the long side, while short positions may be capped near $75,500 pending confirmation of a breakdown. This balanced risk positioning suggests that volatility expansion is probable once directional clarity emerges.
Institutional Implications and Market Outlook
From an institutional perspective, the current rangebound consolidation offers both a testing ground for conviction and a risk management opportunity. Large market participants have demonstrated sufficient interest to drive prices from $70,292 to nearly $76,000, indicating ongoing institutional demand for Bitcoin as a portfolio asset. However, the consolidation pattern suggests that this buying interest is not yet overwhelming at current valuation levels and that sellers are willing to defend resistance areas with meaningful volume. The maintenance of the $73,150 Fibonacci support and the emergence of the $72,000 trend line suggest that institutional buyers view deeper pullbacks as accumulation opportunities rather than breakdowns, supporting a constructive intermediate outlook.
The binary technical outcome—either a break above $75,500 or a breakdown below $72,000—will likely determine Bitcoin’s trajectory for the following trading period. A decisive upside break would validate the rally structure and potentially attract additional institutional capital seeking exposure at confirmatory levels, while a breakdown would require a retest of lower support zones before renewed upside attempts. The positioning data and technical structure suggest that breakout momentum is building, though this momentum remains conditional on price confirming above resistance. The relatively balanced support and resistance architecture indicates that the market is orderly and institutional in nature, rather than exhibiting panic or capitulation characteristics that would typically precede major directional moves.
Looking forward, institutional investors should monitor the $75,500 resistance level with particular attention to volume patterns and price action surrounding potential breakout attempts. A break above this level on above-average volume would likely signal sufficient institutional conviction to support higher prices toward $78,000. Conversely, repeated failures to break $75,500 combined with declining volume would suggest institutional buyers are exhausted at current levels and that consolidation may need to expand downward toward the $72,000–$73,150 support zone. The current setup presents a favorable risk-reward structure for institutions seeking exposure on dips toward $73,150, while also offering clear stop-loss levels at $72,000 for directional positioning. The rangebound consolidation, while frustrating for short-term traders, is constructive from a structural perspective and likely represents the foundation-building necessary before Bitcoin executes the next significant directional move.
Bitcoin has broken below a critical support zone, falling to fresh weekly lows as technical momentum shifts decisively in favor of sellers. The cryptocurrency’s inability to hold the $66,000 level signals weakening conviction among buyers, with multiple technical indicators now pointing toward sustained downside pressure in the near term.
As of recent trading sessions, Bitcoin has slipped beneath the 100-hour moving average and tested lows near $63,351. While the asset briefly recovered above $64,000, it remains significantly detached from the 23.6% Fibonacci retracement level derived from the recent $68,652 to $63,351 range. This positioning suggests bulls lack the strength to establish and maintain higher price zones at present.
Market Context and Industry Backdrop
Bitcoin’s recent weakness occurs against a backdrop of evolving macroeconomic conditions and shifting investor sentiment across digital asset markets. The broader cryptocurrency industry has experienced considerable volatility in recent quarters, with institutional adoption metrics competing against concerns regarding regulatory clarity and monetary policy trajectories. Major exchanges have reported fluctuating volumes during recent price swings, reflecting the tension between long-term conviction holders and tactical traders responding to short-term technical deterioration.
The digital asset market capitalization has contracted meaningfully from its peak levels, with Bitcoin’s dominance metrics showing both consolidation and occasional weakness as altcoins capture rotational flows. Trading volume patterns across major venue operators—including spot and derivatives markets—suggest that recent sell-offs reflect a genuine shift in positioning rather than superficial algorithmic trading. Institutional clients have reportedly trimmed exposure amid the technical deterioration, while retail participation has shown cyclical patterns consistent with fear-driven liquidations.
Technical Breakdown and Price Scenarios
The current technical setup presents two distinct pathways for near-term price movement. In a bullish scenario, if Bitcoin can stabilize and consolidate above $64,000, traders may see renewed attempts to recapture the $65,250 resistance zone. A sustained close above that level would theoretically clear the path toward $66,000 and potentially the 50% Fibonacci retracement around $66,800.
However, a breakdown below $65,250 would likely accelerate selling pressure. The immediate support floor sits at $64,000, with secondary support at $63,500. Further down, the $63,200 and $62,650 levels represent additional backstops for downside movement.
A breakdown below $62,000 would represent a critical capitulation point where recovery momentum becomes substantially constrained.
— Technical Analysis Framework
Key Support Levels
$65,250 (first resistance), $64,000 (immediate support), $63,500, $63,200, and $62,650 (secondary supports). A break below $62,000 signals potential capitulation.
Momentum Indicators Paint a Bearish Picture
Multiple technical indicators align with the bearish narrative now playing out in Bitcoin price action. The hourly MACD has gathered negative momentum, signaling sustained selling pressure at shorter timeframes. The relative strength index for BTC/USD currently trades below 50, a level that traditionally separates bullish from bearish territory.
Importantly, the RSI is not yet in deeply oversold conditions—a reading that would typically suggest a reversal. This means the technical setup allows for further downside without immediately triggering mean-reversion buying.
A bearish trend line continues to form resistance in the $66,800 region on the hourly chart. For a sustained recovery to take root, buyers would need to overcome this trend line and extend toward $67,500 to $67,700—levels that represent meaningful rejuvenation for the bulls.
Institutional and Market Implications
The current price action carries significant implications for market participants across the cryptocurrency ecosystem. For institutional investors managing substantial digital asset allocations, the technical deterioration creates portfolio management challenges, particularly regarding rebalancing strategies and risk control frameworks. Major asset managers have historically used technical support breaks as signals for tactical position reductions, amplifying cascading selling when key levels fail.
Market makers and high-frequency trading operations have responded to the deteriorating momentum by widening bid-ask spreads and reducing liquidity provision at key support zones. This dynamic exacerbates downside moves during panic-driven selling, creating self-reinforcing feedback loops that extend declines beyond what fundamental factors alone would justify. The phenomenon has been documented extensively in cryptocurrency market microstructure studies, where sudden liquidity withdrawal accelerates capitulation phases.
For derivative markets, the technical weakness has triggered cascading liquidations in leveraged long positions, particularly affecting retail traders utilizing margin accounts. Liquidation volumes during recent sell-offs have reached substantial levels, with on-chain data providers noting concentrated liquidation events at key support breaks. This liquidation cascade creates additional selling pressure, compounding the technical deterioration narrative.
What Investors Should Monitor
For institutional and retail traders alike, several price zones warrant close attention. The $65,000 to $66,000 resistance cluster remains the first meaningful barrier for any recovery attempt. A hold above $64,000 would suggest some underlying bid, while a loss of that level accelerates downside momentum toward the $63,500 zone.
The broader context matters as well. Bitcoin’s performance relative to macro conditions, regulatory developments, and macro fund positioning continues to influence directional bias. Traders monitoring crypto price movements should consider whether recent weakness reflects genuine selling or consolidation ahead of fresh buying. Additionally, monitoring on-chain metrics—including exchange inflows, whale transaction activity, and long/short positioning ratios—provides complementary signals to technical analysis frameworks.
The cryptocurrency briefly recovered above $64,000 but remains significantly below key Fibonacci levels, indicating that bulls lack the conviction to establish sustained higher levels.
— Technical Assessment
Industry Challenges and Regulatory Environment
Bitcoin’s recent weakness cannot be fully divorced from the regulatory environment facing cryptocurrency markets globally. Recent regulatory announcements from major jurisdictions have created uncertainty regarding institutional participation frameworks. Simultaneously, ongoing discussions regarding central bank digital currencies and their potential competitive dynamics with decentralized cryptocurrencies have introduced structural headwinds for sentiment.
Energy consumption narratives, mining concentration concerns, and environmental policy developments have periodically influenced institutional investor participation decisions. These macro factors combine with technical weakness to create a challenging environment for recovery attempts. Industry participants have worked toward greater sustainability standards and transparency regarding operational practices, yet regulatory clarity remains elusive in many markets.
Implications for Near-Term Trading
The current technical setup favors patience for buyers. Attempting to catch falling knives near resistance zones carries elevated risk given the momentum disadvantage. More prudent entries would likely emerge if Bitcoin can stabilize and show a material reversal pattern at lower support levels.
For those already holding positions, the $63,500 to $64,000 band represents a logical area to reassess conviction. A hold at these levels suggests underlying support; a failure triggers the next cascade toward $62,650 and eventually the critical $62,000 threshold.
Trading Perspective
The hourly MACD shows deteriorating momentum, RSI sits below 50, and a bearish trend line forms resistance overhead. The technical environment favors caution until clearer reversal signals emerge at lower price zones. Position management and risk controls should prioritize capital preservation during periods of momentum deterioration.
The past several sessions have clearly demonstrated that buyers lack the firepower to sustain pushes above $65,250. This repeated failure suggests sellers remain in control and will test lower levels with conviction. For blockchain market updates and deeper analysis, monitoring technical developments remains essential as the situation evolves.
Conclusion: The Path Forward
Bitcoin’s current technical posture presents a defining moment for market participants. The cryptocurrency stands at a critical juncture where sustained support at current levels could establish a foundation for recovery, or capitulation below key thresholds could trigger extended consolidation toward the $62,000 zone. For institutional investors managing substantial allocations, the technical deterioration demands careful position reassessment and risk management execution.
The broader cryptocurrency industry watches Bitcoin’s price action with acute attention, as Bitcoin remains the market’s primary valuation anchor and sentiment barometer. A successful stabilization and recovery from current levels would likely reignite institutional participation and generate renewed momentum across digital asset markets. Conversely, a test of deeper support zones would reinforce caution and potentially attract defensive positioning from larger market participants.
Bitcoin’s path forward hinges on whether support can be established at current levels or if accelerated selling forces a test of the $62,000 capitulation zone. Until the technical indicators show material reversal—such as an RSI break above 50 combined with positive MACD divergence—the bearish bias remains the operative framework for near-term traders. Market participants should remain cognizant that technical reversals often require volume confirmation and momentum alignment across multiple timeframe indicators before sustainable recoveries emerge. The next several trading sessions will likely prove pivotal in determining whether Bitcoin establishes a durable bottom or extends weakness toward strategic support zones that would carry broader industry implications.
Get weekly blockchain insights via the CCS Insider newsletter.