Solana analysts forecast $262.60 target for 2026, $631.85 average by 2032
Solana price forecasts extending through 2032 suggest sustained upside for institutional investors, with predictions anchored to network fundamentals and technical indicators rather than speculative sentiment alone. Understanding the multi-year trajectory and near-term technical pressure points is essential for portfolio positioning.
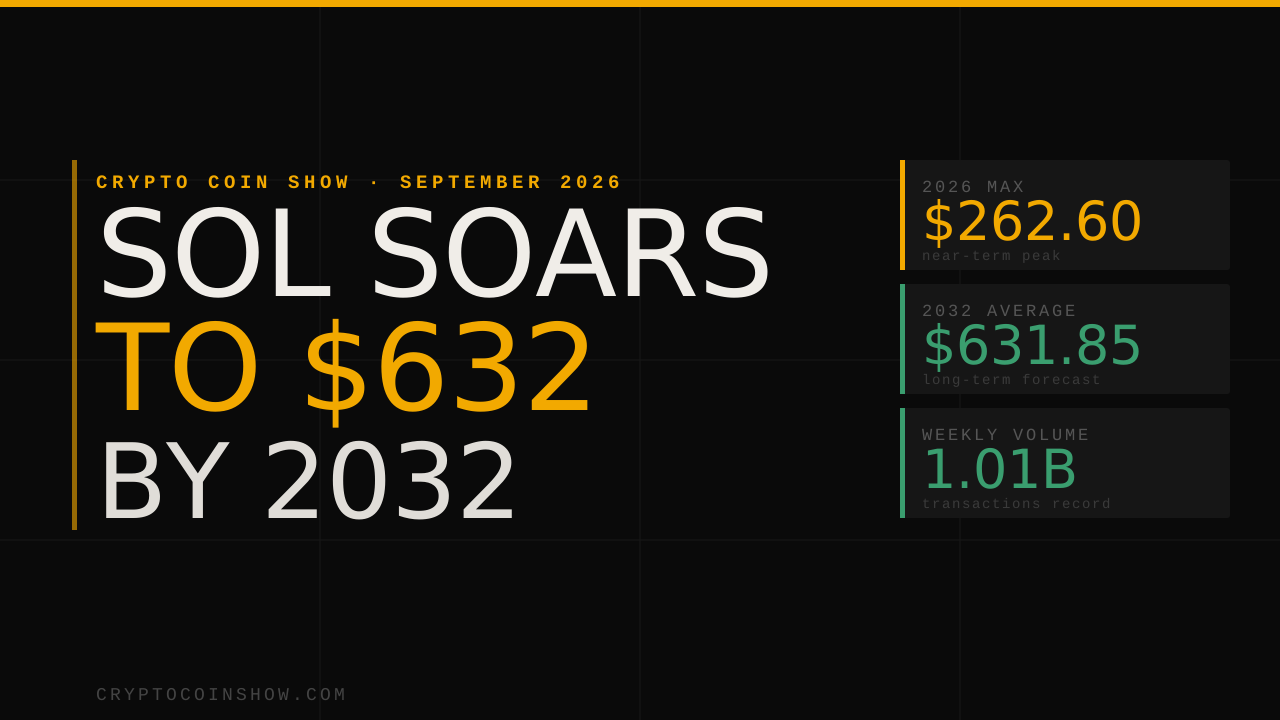
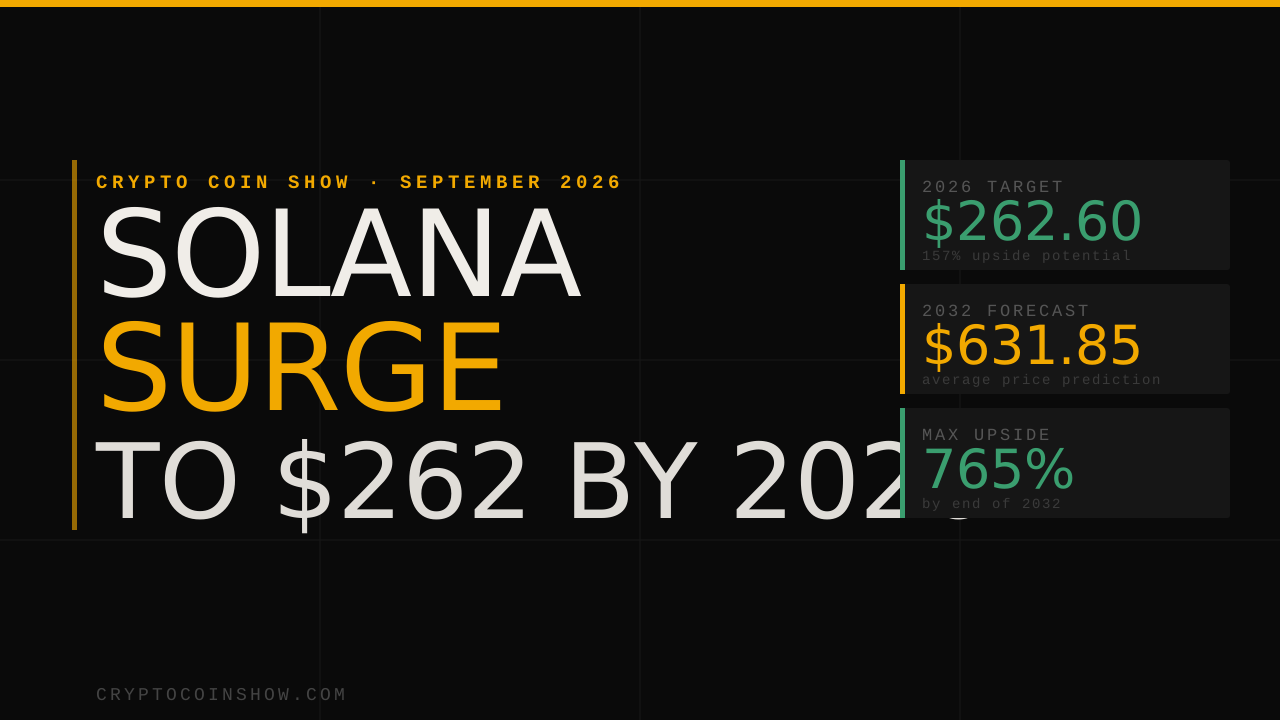
- SOL predicted to reach $262.60 by end of 2026, up 157% from current levels near $102
- By 2032, average price forecast of $631.85 with maximum range to $880.41, representing 765% upside
- Current technical pressure at $100 support level with bearish short-term momentum despite bullish longer-term trajectory
- $262.60 Solana price target for 2026 compared to current trading level
- $631.85 Average predicted price in 2032 versus 2026 average of $169.07
- 1.01B Weekly transactions recorded August 2-9, 2026 all-time high for network
Solana’s seven-year price trajectory reflects a consensus thesis among analysts that the network’s fundamental improvements and adoption metrics will drive sustained appreciation, despite near-term volatility. According to Cryptopolitan’s analysis, SOL is forecast to trade with a 2026 range of $67.34 to $262.60, with an average of $169.07, implying 65% upside from current levels. By 2032, the average prediction expands to $631.85, with potential peaks near $880.41 under favorable conditions. The forecasts incorporate technical momentum indicators, network activity milestones, and competitive positioning in decentralized finance and Web3 infrastructure.
Transaction records and network adoption accelerate 2026 momentum
Solana’s all-time weekly transaction record of 1,012,226,009 transactions in the week ending August 2 demonstrates sustained network utility that underpins bullish medium-term forecasts.
This metric exceeds prior activity baselines and signals genuine ecosystem demand rather than speculative trading volume alone, addressing prior concerns about network congestion that had plagued investor sentiment.
The surge in weekly transactions correlates with broader developer ecosystem growth and institutional adoption of decentralized applications built on Solana. This fundamental improvement reduces the risk premium previously priced into SOL valuations and strengthens the case for price appreciation beyond near-term technical pressure.
Short-term technical breakdown conflicts with multi-year bull thesis
As of September 12, SOL trades at $102 after retreating from a $108 intraday high, with technical indicators on the daily chart suggesting near-term downside to $100 support.
The Relative Strength Index (RSI) at 57.59 indicates overbought conditions despite declining momentum, while Bollinger Bands show widening volatility between a $107.99 resistance ceiling and a $96.93 support floor. The four-hour chart compounds the bearish tilt: RSI has fallen to 50.84, suggesting room for further pullback before buyers re-engage.
Most daily and exponential moving averages remain in buy mode, critical because the 50-day and 200-day simple moving averages at $86.88 and $82.94 respectively sit well below current price, supporting a longer-term uptrend structure intact even amid short-term consolidation.
Competitive positioning and infrastructure milestones remain central to 2030s forecasts
The 2029-2032 price predictions assume Solana maintains market leadership in throughput and cost efficiency relative to competing Layer 1 networks. At current trajectories, annual transaction volumes would support an ecosystem capable of handling enterprise-grade decentralized finance and tokenized asset settlement, two use cases now moving into production across institutional infrastructure.
The average price of $631.85 by 2032 implies Solana’s market capitalization would expand to roughly $368 billion at current circulating supply, contingent on sustained network utility and absence of disruptive competitive threats.
Reaching the $1,000 level by mid-2030s, as suggested in the forecasts, requires compound annual appreciation of approximately 22% from 2026 onward. This pace is achievable but not certain; it depends on Solana’s ability to retain developer mindshare, avoid extended downtime, and capture material share of institutional settlement flows as blockchain infrastructure matures.
Institutional investors should monitor the September-October consolidation zone between $100 and $108 as a decisive technical level: a breakdown below $100 would signal a deeper pullback toward $85-90 and cast doubt on near-term forecasts, while a sustained move above $108 with volume would confirm accumulation ahead of 2026 upside targets. The network’s ability to sustain transaction velocity above 1 billion weekly, and expand it further through 2025, will serve as the critical real-world validator of whether analyst price targets reflect genuine adoption or extrapolation of transient market conditions.