SOL projected to average $631.85 by 2032 on sustained blockchain adoption outlook
Solana price forecasts for 2026-2032 show SOL potentially trading between $67 and $262 this year, then rising to an average of $631 by 2032, reflecting analyst expectations for sustained blockchain adoption and network growth. These projections matter to institutional investors evaluating multi-year exposure to high-throughput layer-1 platforms amid competition from rival chains and ongoing network stability concerns.
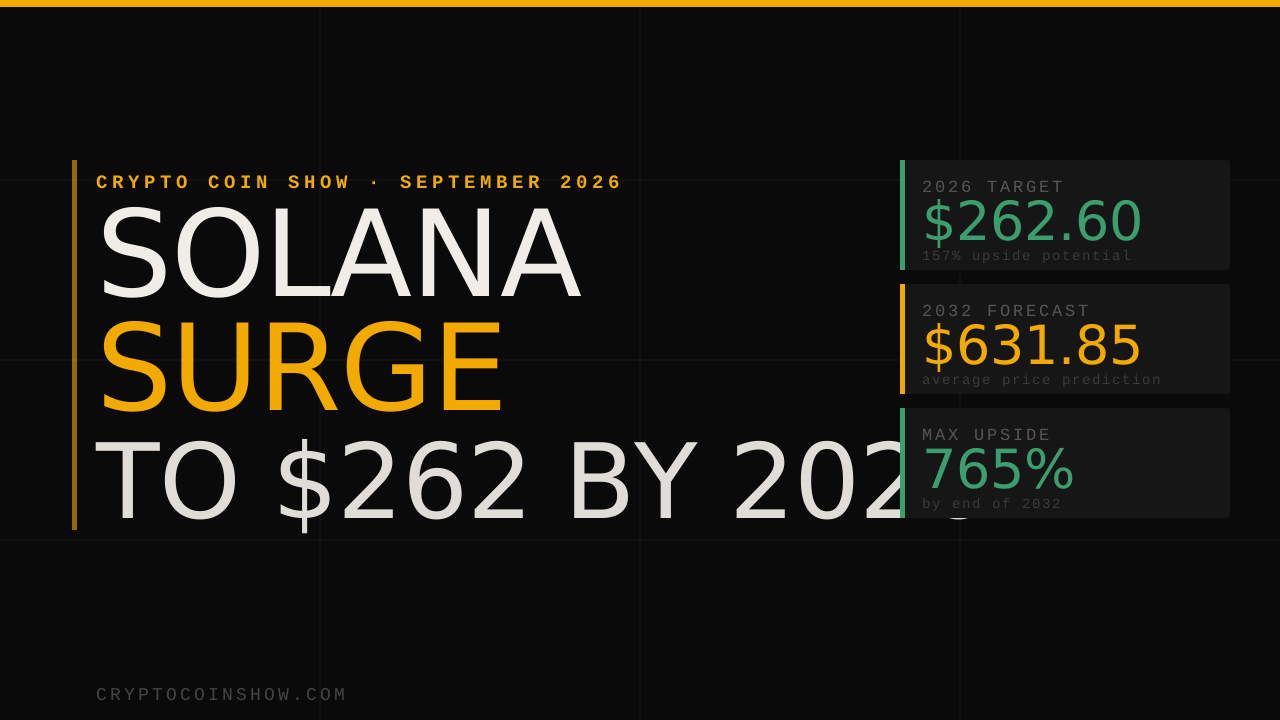
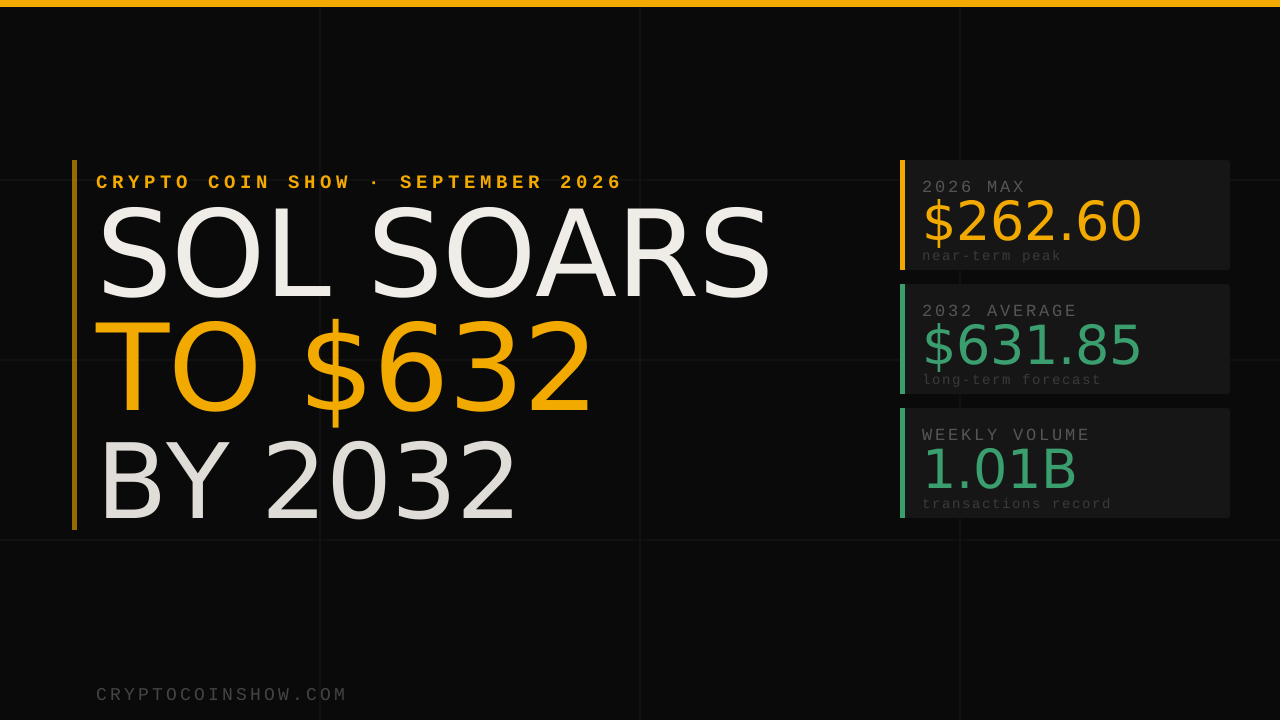
- SOL forecast to reach $262.60 maximum in 2026, with average price of $169.07 across the year
- By 2032, analysts project average price of $631.85, with range of $383.30 to $880.41
- Network recorded 1.01 billion transactions in single week (July 27, August 2), marking all-time high
- $262.60 Maximum SOL price projection for 2026 versus current level near $102
- $631.85 Projected average price by 2032 compared to 2026 average of $169.07
- 1.01B Weekly transaction record set in late July 2026 representing network throughput milestone
Solana is positioned to trade significantly higher over the next seven years if current network adoption and market sentiment hold, according to price analysis from multiple forecasters. The blockchain’s ability to process high transaction volumes, evidenced by a recent 1.01 billion transaction milestone in a single week, underscores the technical foundation that analysts cite when projecting long-term upside. Yet the gap between current spot prices and forecast peaks reveals the extent to which institutional adoption, developer activity, and competitive positioning remain open variables over a seven-year horizon.
Analyst projections show 6.4x upside from current level by 2032
The consensus forecast trajectory shows SOL climbing from its current price near $102 to an average of $631.85 in 2032, a 520% increase over seven years. The range of outcomes widens materially in outer years: 2032 predictions span from a floor of $383.30 to a ceiling of $880.41, reflecting heightened uncertainty as forecast periods extend.
By comparison, 2026 predictions cluster more tightly, with a range from $67.34 to $262.60.
Multiple forecasters including Changelly and DigitalCoinPrice have published 2026-2027 targets. Changelly projects $167 for 2026 and $248 for 2027, while DigitalCoinPrice forecasts $132.89 and $162.57 for the same years respectively. These variations highlight the sensitivity of long-term projections to model inputs and underlying assumptions about adoption velocity and competitive dynamics.
Institutional investors should note that the widest uncertainty band occurs in 2029-2032, when forecasts diverge most sharply.
Network resilience and transaction volume support bullish case despite prior congestion concerns
Solana’s technical roadmap has historically centered on throughput and cost efficiency, metrics where it claims material advantages over Ethereum and other rivals. The recent achievement of over 1 billion weekly transactions represents validation of that engineering approach, though the network has faced periodic congestion events and validator stability challenges since launch.
Analyst commentary accompanying these forecasts emphasizes scalability, low transaction fees, and a growing developer ecosystem as primary tailwinds. The framing echoes broader institutional interest in platforms built for high-throughput use cases, where traditional finance and decentralized systems increasingly intersect. However, forecasters also acknowledge that competition from other high-performance chains, regulatory uncertainty, and macroeconomic cycles pose downside risks, factors reflected in the wide confidence intervals, particularly for 2030-2032.
Current technical setup shows short-term weakness despite long-term optimism
Near-term price action presents a different picture: at the time of the analysis, SOL had retreated from $108 to $102, with technical indicators signaling overbought conditions and resistance above $104.
The 14-day Relative Strength Index (RSI) at 66.49 falls in neutral-to-overbought territory, and moving averages at the 50-day ($86.97) and 200-day ($82.94) levels remain below spot price, suggesting recent strength is building on intermediate uptrend rather than a fresh breakout.
Support levels sit at $100, with Bollinger Band analysis indicating elevated volatility. A decline toward $96, $98 would test key intraday support and potentially signal a broader pullback before any reacceleration toward 2026 targets.
For institutional traders managing 30-day to 90-day horizons, this divergence between multi-year bullish forecasts and shorter-term technical weakness underscores the importance of entry discipline and volatility management when establishing or averaging into Solana positions.
The key watch will be whether Solana maintains the $100 support level in the coming weeks, and whether on-chain transaction volume continues to climb toward and beyond the 1 billion weekly milestone. If the network sustains both metrics while developer activity on platforms like embedded finance infrastructure deepens, the multi-year forecast range becomes more credible; failure to hold either technical or on-chain support would warrant downward forecast revision.