Ripple Price Analysis: XRP Looks Ready for a Comeback as Sellers Fade
Ripple’s XRP has stabilized above critical support levels after months of decline, signaling that institutional selling pressure may be easing and creating conditions for a potential recovery attempt. For institutional investors, this technical shift matters because it identifies specific price thresholds where conviction will be tested and determines whether XRP can rebuild toward higher resistance zones or reverses back into its downtrend.
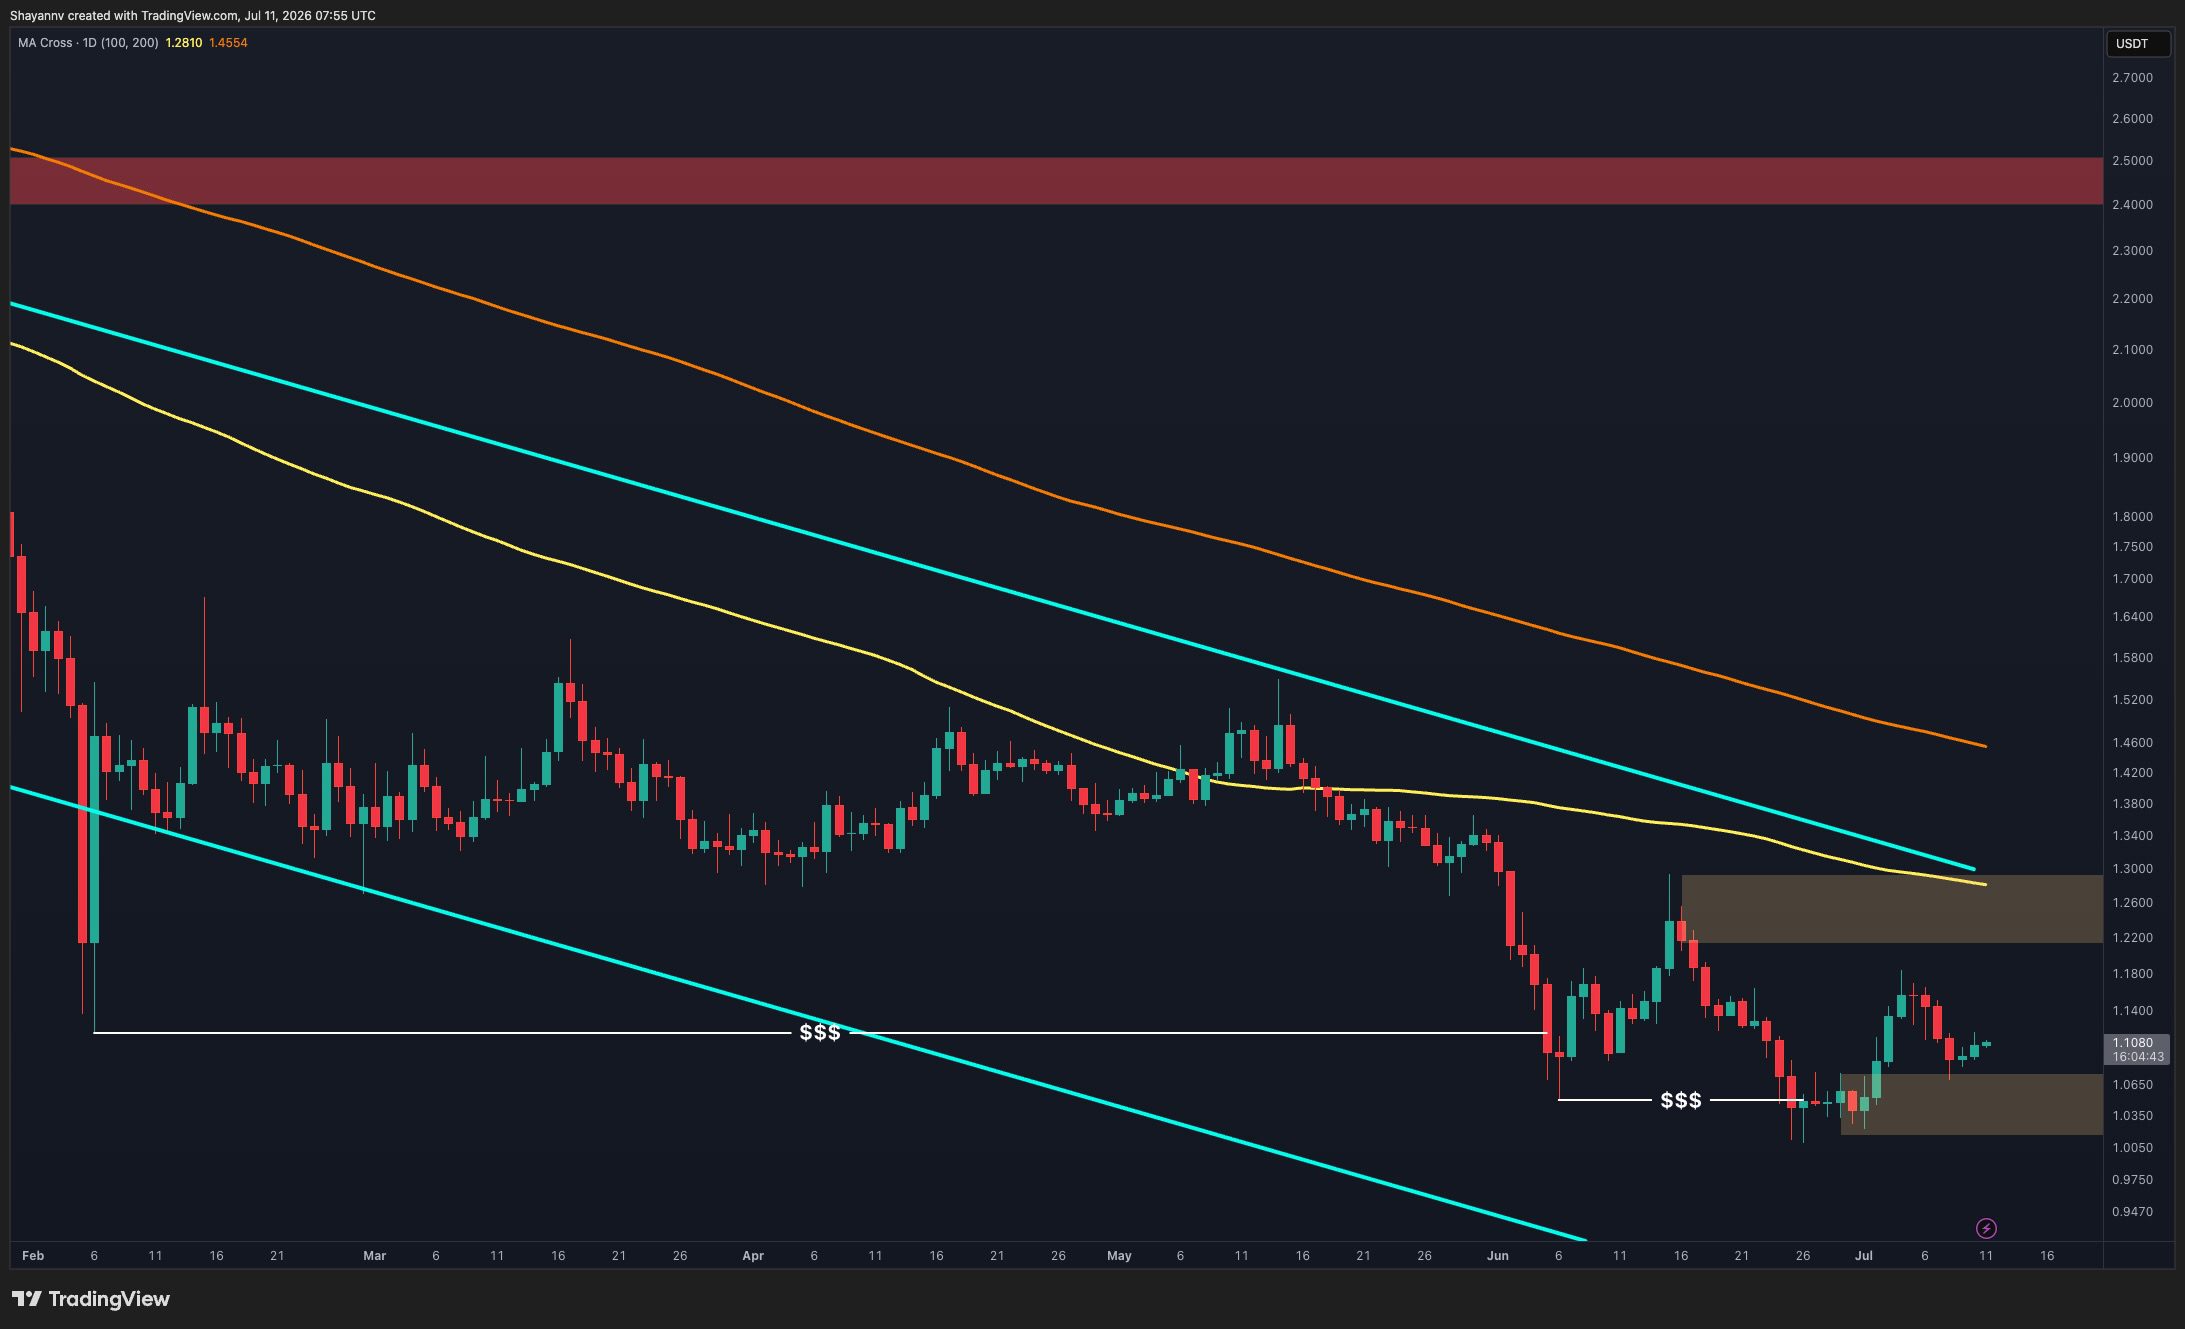
- XRP established a higher low above the $1.02, $1.06 support zone after buyers defended it against a liquidity sweep
- The asset faces resistance at $1.22, $1.28 on the daily chart, coinciding with the 100-day moving average and broader channel boundary
- A breakout above the descending trendline near $1.15, $1.18 on the 4-hour chart would confirm momentum and target the $1.22, $1.28 zone
- $1.02, $1.06 Support zone where buyers are defending demand after liquidity sweep
- $1.22, $1.28 Resistance region aligning with 100-day moving average and channel upper bound
- $1.15, $1.18 Trendline resistance on 4-hour chart where breakout confirmation would accelerate recovery
Ripple’s XRP has broken a prolonged pattern of seller dominance, establishing a market structure shift that suggests short-term momentum is rotating toward buyers. After declining into a support zone between $1.02 and $1.06, a region that previously marked a liquidity sweep below April lows, the token has formed a higher low and begun building a base above this demand area.
This technical development matters to institutional investors because it identifies the first concrete evidence that accumulation may be occurring at depressed levels rather than continued capitulation. The broader daily trend remains bearish, with price still trading below both the 100-day and 200-day moving averages, which continue sloping lower.
However, the recent stabilization demonstrates that sellers are no longer in complete control, creating asymmetric risk conditions for tactical positioning.
Buyers Defend $1.02, $1.06 Support Zone After Months of Losses
XRP’s recovery attempt rests on a foundation established when the token bounced sharply from the $1.02, $1.06 support region after touching it during a liquidity sweep. This is significant because the zone has now attracted sufficient buying interest to hold price above the lows, preventing a retest that would typically occur in a pure downtrend.
The fact that the asset has established a higher low rather than breaking support is the first technical confirmation that the selling pressure that dominated from mid-June onward may be exhausting.
The support zone itself carries additional weight because it aligns with previous structural levels, giving buyers multiple confluence reasons to defend it. When a support area is tested and held multiple times, especially after initially being swept, it often indicates that large buyers are using the dislocation to accumulate.
For institutional investors, this is a critical signal because it suggests that the recent decline may have represented a repositioning phase rather than a fundamental loss of conviction in XRP as a holding.
The longer XRP remains above this support zone, the more likely the recovery structure becomes genuine rather than a false bounce into a larger decline.
Daily Resistance at $1.22, $1.28 Marks Make-or-Break Level for Recovery Credibility
The immediate recovery target for XRP is the $1.22, $1.28 resistance zone on the daily chart, a region that carries multiple layers of technical significance.
This band coincides with the descending 100-day moving average, the first moving average barrier to clear in a genuine reversal, and also marks the upper boundary of the broader descending channel that has defined the downtrend since mid-2024.
A successful reclaim of this zone would accomplish two objectives: it would signal that XRP has momentum to break above the short-term moving average cap, and it would demonstrate that buyers have enough strength to challenge the upper edge of the bearish structure itself.
For institutional traders, this level represents a decision point. If XRP rallies to $1.22, $1.28 and is rejected, it suggests that the recovery is corrective rather than trending, and sellers remain positioned at higher prices to fade rallies.
Conversely, a clean breakout above $1.28 would open the path toward the major supply area near $1.55, representing a potential 24% move from current support levels and a meaningful test of whether the downtrend is genuinely breaking or merely consolidating before a deeper decline.
The descending nature of the 100-day moving average is particularly important because it means this resistance target is drifting lower in absolute terms over time, narrowing the window for bullish breakout.
Every week that passes with XRP unable to reclaim this zone means the moving average drifts lower, making the breakout technically easier from a price standpoint but psychologically damaging for conviction.
4-Hour Chart Market Structure Shift Confirms Short-Term Momentum is Rotating
On the 4-hour timeframe, the technical setup appears more constructive than the daily chart suggests. Following the liquidity sweep below $1.02, $1.06, XRP formed a market structure shift, a change in the pattern of lower lows and lower highs, indicating that sellers are no longer making fresh lows with conviction.
This was followed by a change of character, where the token broke above a previous lower high and challenged a descending trendline that has capped rallies since mid-June.
The significance of this trendline cannot be overstated for short-term traders and tactical institutional positions. A trendline that has capped multiple rallies over several weeks represents an area where sellers have repeatedly entered, pushing price back down.
When price approaches and breaks above such a trendline with volume and conviction, it often marks the point where the short-term trend genuinely reverses. Currently, XRP has tested the trendline near $1.15, $1.18 but faced rejection and pulled back.
However, the pullback has remained relatively shallow, and buyers have continued to defend the former breakout level, suggesting that demand remains active.
A decisive break above the $1.15, $1.18 trendline would confirm a higher-high formation and likely accelerate momentum toward the daily resistance zone of $1.22, $1.28.
Next Test: Whether XRP Can Sustain Above $1.15, $1.18 Trendline Before Monthly Reset
The immediate action to watch is whether XRP can hold above the $1.03, $1.06 support while building enough momentum to break decisively above the $1.15, $1.18 trendline resistance. This is not a trivial breakout: the trendline represents three months of seller defense, and breaking it would be the clearest signal that the short-term structure has genuinely shifted from bearish to bullish.
If XRP accomplishes this, the next target becomes the daily resistance zone at $1.22, $1.28, where a successful clearance would open the path toward $1.55.
The recovery scenario remains conditional rather than confirmed. The broader daily trend is still bearish, with price still below both major moving averages and still inside the descending channel. What has changed is the short-term momentum and the evidence of buyer interest at lower levels.
For institutional investors, this creates a tactical opportunity: if the recovery gains traction, a breakout above $1.22, $1.28 would represent a meaningful intermediate-term position entry point with clear risk definition below the recent support zone.
The critical date and level to monitor is XRP’s next approach to the $1.15, $1.18 trendline resistance on the 4-hour chart; if the token breaks decisively above this zone on volume and price remains above the level following the breakout candle, the recovery thesis gains institutional conviction and targets the $1.22, $1.28 daily resistance as the next decision point for larger position entries.
Original reporting: cryptopotato.com