Solana memecoin trading platform Pump.fun has removed agent mode for new token launches, following community requests.
Pump.fun announced the decision on Tuesday, saying the Tokenized Agent launch option is deprecated, effective immediately. Co-founder Alon Cohen said it’s the first step to “removing launch options that don’t add enough value to users.”
Last month I promised that we would start removing launch options that don’t add enough value to users.
Today, we began this process, and are continuing to take big steps towards a healthier ecosystem. 🧵 https://t.co/OnKOH3LRU9
Cohen said the Tokenized Agents feature was introduced with the intention of bootstrapping on-chain agents with automated buyback and burn mechanics. However, it resulted in excessive griefing, confusion among traders, and “needless PVP.”
“Coins PVPing each other because of launch modes benefits no one. It slows down momentum for narratives and pushes people away from our ecosystem,” Cohen wrote on X.
The change applies to new token launches, according to Pump.fun. Existing coins that already enabled the agent mode feature will remain unaffected.
Cohen did say Pump.fun is still “super bullish” on the Tokenized Agents sector, adding there is a possibility the feature returns, but not as a launch option.
Community cites rare “W”
The Pump.fun community seems well receptive of the decision. Most of the reactions agree that removing the agent mode was a much-needed move.
Meanwhile, the news comes as Pump.fun activity heats up again, with the launch of a new token dubbed $ANSEM. The memecoin made the rounds on X after surging by 8500% over the last two days, reaching a $172M market cap.
The token is named after the popular Solana memecoin influencer Ansem, who reportedly holds 604M $ANSEM, representing more than 60% of the supply.
On Monday, Ansem had airdropped $6.7M in $ANSEM to 700+ wallets, with most of the recipients still holding their tokens.
UPDATE: 60% are STILL holding their $ANSEM airdrop
Some traders argue that Pump.fun’s decision to deprecate the agent mode is only coming due to Ansem’s influence.
Another Pump.fun feature goes badly
Pump.fun has had to deal with extreme cases where its features are used for unintended reasons.
Cryptopolitan once reported that live streamers on Pump.fun staged a fake private jet crash to lure viewers and pique their interest in their memecoin. Following a series of similar stunts, Pump.fun eventually removed the live-streaming feature.
Earlier in June, Pump.fun launched a “Pay ANYONE to do ANYTHING” bounty marketplace called Pump Fun GO. Just a few hours after launch, a user posted a bounty worth 10,000 SOL (roughly $690,000) referencing suicide, Cryptopolitan reported.
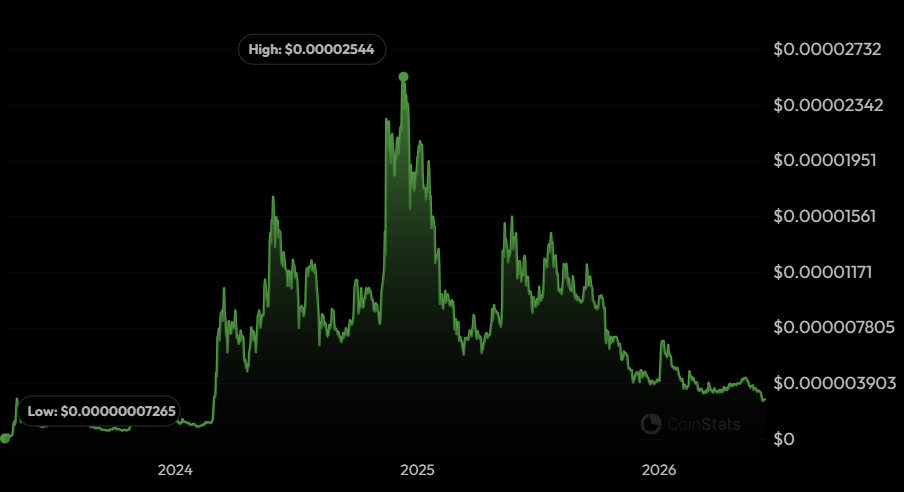
Our Pepe price prediction for 2026 is a maximum price of $0.000025
In 2032, we expect the Pepe price to touch $0.00035.
The meme coin sector momentarily slowed down, hinting at a potential rally if the broader market stabilizes after its recent downturn. Specifically, PEPE coin prices display a bullish pattern, presenting an opportunity for a breakout based on the daily chart analysis.
Moreover, the volatility of meme coins is exacerbated by the prevailing market uncertainty. This causes fluctuations in PEPE prices as they oscillate in search of a solid support level to initiate a recovery.
Considering investing in Pepe crypto?
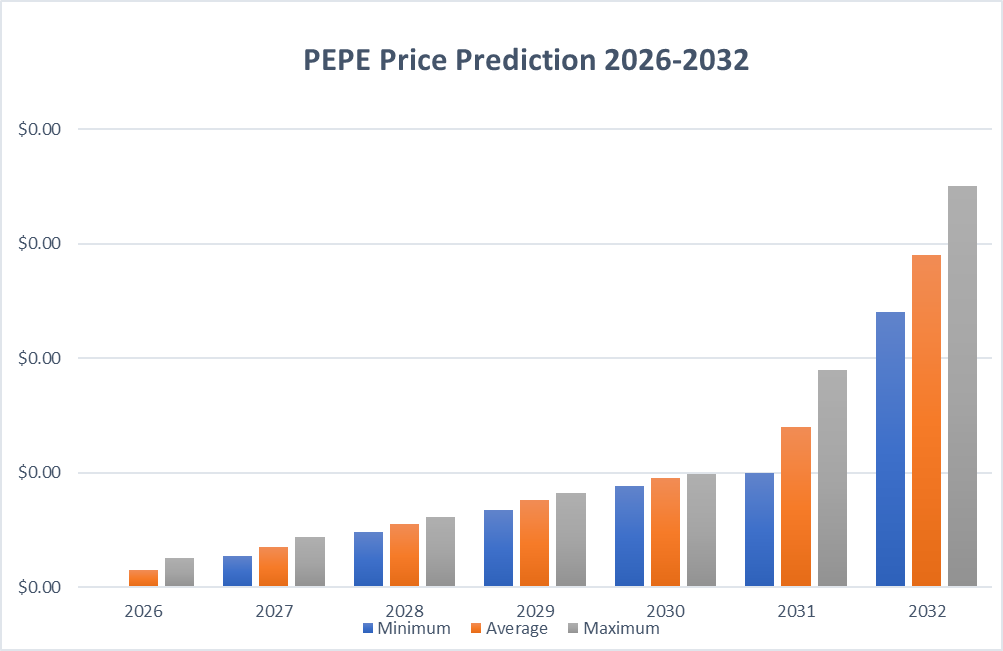
Explore our Pepecoin price prediction from 2026 to 2032. We offer an in-depth analysis of the anticipated price movements for the PEPE coin.
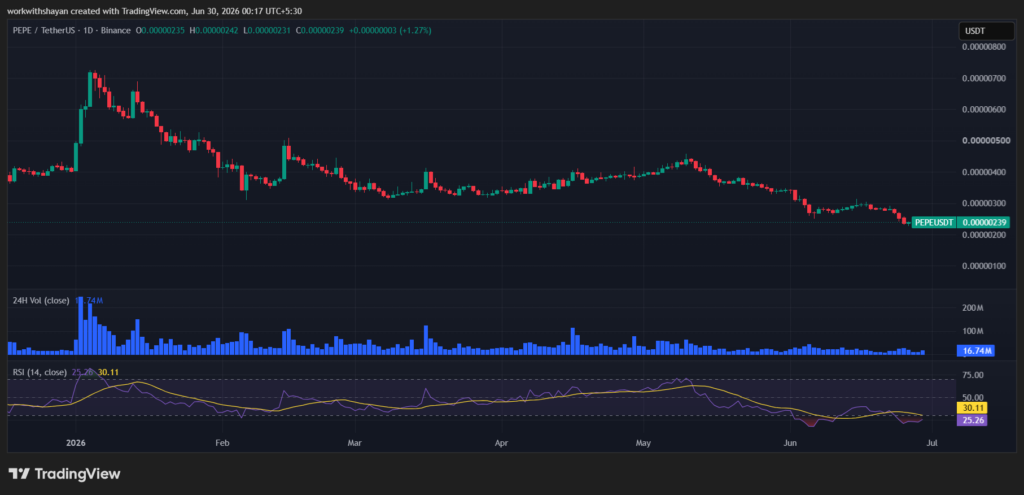
The PEPE price analysis for 29 June confirms Pepe faced bearish pressure as sellers pushed the price toward $0.00000235. Currently, sellers are dominating the pepe price chart.
Analyzing the daily price chart of Pepe coin, Pepe’s price witnessed a surge in bearish volatility over the last few hours. Buyers liquidated around immediate resistance channels. This resulted in a decline toward $0.00000235. The 24-hour volume surged to $29 million, showing an increase in trading interest. Pepe is trading at $0.00000235, declining over 0.1% in the last 24 hours.
The RSI-14 trend line has surged from its previous level and trades at level 35, hinting at a minor bullish trend. The SMA-14 level suggests volatility in the next few hours.
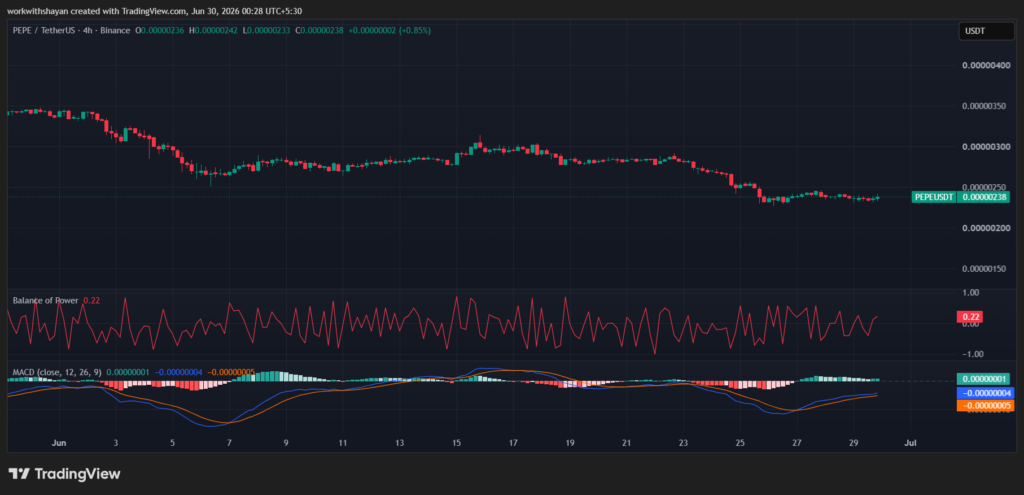
PEPE/USDT 4-hour price chart: Buyers aim for further surges
The 4-hour Pepe price chart suggests that bulls dominate as PEPE holds around EMA levels. Currently, bulls are aiming for a significant recovery.
The BoP indicator trades in a positive region at 0.22, showing that short-term buyers are taking a chance to accelerate an upward trend.
Additionally, the MACD trend line has formed green candles above the signal line, and the indicator aims for positive momentum, strengthening long-position holders’ confidence.
Pepe technical indicators: Levels and action
Daily simple moving average (SMA)
Period
Value
Action
SMA 3
$ 0.000002721
BUY
SMA 5
$ 0.000002846
SELL
SMA 10
$ 0.000003094
SELL
SMA 21
$ 0.000003360
SELL
SMA 50
$ 0.000003715
SELL
SMA 100
$ 0.000003599
SELL
SMA 200
$ 0.000004116
SELL
Daily exponential moving average (EMA)
Period
Value
Action
EMA 3
$ 0.000002789
BUY
EMA 5
$ 0.000002860
SELL
EMA 10
$ 0.000003034
SELL
EMA 21
$ 0.000003289
SELL
EMA 50
$ 0.000003546
SELL
EMA 100
$ 0.000003787
SELL
EMA 200
$ 0.000004634
SELL
What to expect from PEPE price analysis next?
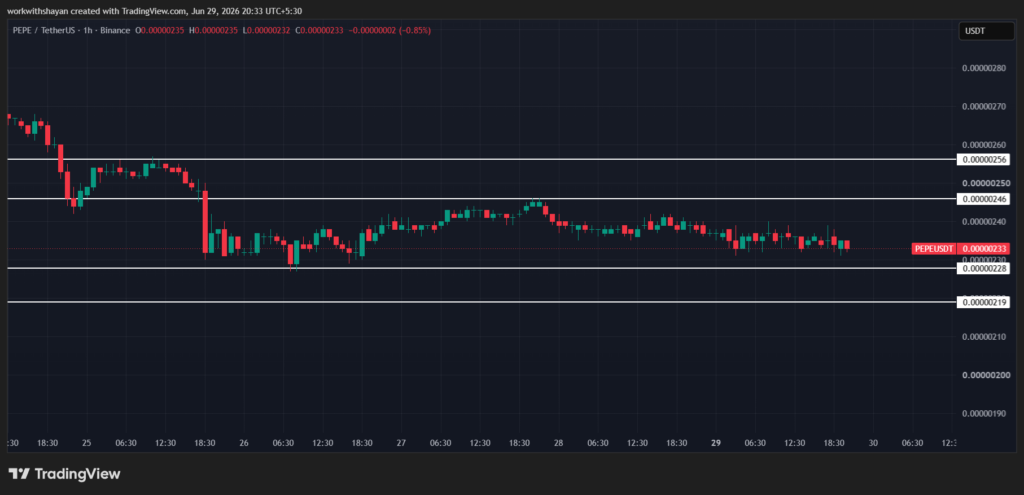
The hourly price chart confirms that Pepe attempts to drop below the immediate support line; however, bulls are eyeing a further recovery rally in the coming hours. If Pepe’s price holds momentum above $0.00000246, it will fuel a bullish rally to $0.00000256.
If bulls fail to initiate a surge, Pepe’s price may drop below the immediate support line at $0.00000228, beginning a bearish trend to $0.00000219.
Recent News on PEPE
LBank has upgraded LBank Pay to support direct payments in 20+ cryptocurrencies, including BTC, ETH, SOL, DOGE, TON, and PEPE, eliminating the need for USDT conversion.
Is PEPE A Good Investment?
Reviewing the Pepe project’s roadmap, it appears there are no detailed plans other than anticipation that $PEPE and similar meme coins will dominate. Given this lack of clear direction and with an already sizable community of over 764,000 Twitter followers, the project’s price growth potential may be capped.
However, meme coins have a reputation for offering significant returns, as their values can surge dramatically when supported by strong community movements.
This was evident when Pepe’s value skyrocketed by over 222% to reach a new all-time high (ATH) following its listing on the Binance exchange. A similar significant announcement in 2026 could propel Pepe to surpass its previous ATH.
Why is Pepe down today?
Pepe’s price faces minor selling around recent highs. This pushed the price of PEPE toward the intra-day low around $0.0000023.
Will Pepe Recover?
If buyers hold the price above the $0.000003 level strongly, we might see further upward rally in the Pepe price chart.
What is Pepe price prediction for 2026?
The Pepe price prediction for 2026 expects the meme coin to record a maximum level of $0.000025.
Will Pepe price reach $0.0001?
Pepe’s price might touch the $0.0001 mark by the end of 2031. However, this price milestone entirely depends on the utility of Pepe coin and future buying demand.
Will Pepe price reach $1?
Pepe has a great community, and the hype is high for the meme coin. If everything remains good, we might see Pepe’s price touch $1 soon or by 2060.
PEPE Price Prediction June 2026
If BTC price records a move toward $70K this month, we might see PEPE price skyrocketing. We expect the PEPE price to record minimum and maximum prices of $0.0000025 and $0.000004, respectively. The average price might be around $0.0000032.
Month
Potential low ($)
Potential average ($)
Potential high ($)
June 2026
0.0000025
0.0000032
0.000004
Pepe price prediction 2026
The Pepe roadmap is somewhat vague, with few definitive plans beyond the expectation that $PEPE and similar meme coins will dominate the market. Despite its robust community, this lack of clear direction might cap the project’s price potential.
Meme coins have a reputation for offering significant financial returns, as their values can surge rapidly when supported by their communities.
The impact of major announcements was evident when Pepe’s value soared by more than 222% following its listing on the Binance exchange, reaching an all-time high.
In 2026, Pepe’s minimum expected price is projected to be $0.000003. It may peak at a maximum value of $0.00002, with an average trading price of $0.000015 throughout the year.
Year
Potential low ($)
Potential average ($)
Potential high ($)
2026
0.000002
0.000015
0.000025
PEPE price predictions 2027-2032
Year
Minimum Price ($)
Average Price ($)
Maximum Price ($)
2027
0.000027
0.000035
0.000044
2028
0.000048
0.000055
0.000061
2029
0.000067
0.000076
0.000082
2030
0.000088
0.000095
0.000099
2031
0.0001
0.00014
0.00019
2032
0.00024
0.00029
0.00035
PEPE price forecast for 2027
Pepe must offer tangible value to reach a valuation comparable to Shiba Inu and Dogecoin. For instance, Shiba Inu is developing Shibarium, a layer-two scaling solution on Ethereum, alongside various protocols and tools for its community. Meanwhile, Dogecoin is enhancing tools and libraries that facilitate the integration of $DOGE as a payment option for businesses.
According to predictions and technical analysis, Pepe could achieve a minimum price of $0.000027 in 2027. The price may rise to a maximum of $0.000044, with an average expected trading price of $0.000035.
Pepe Price Prediction 2028
The forecast for 2028 suggests that Pepe will have a minimum price of $0.000048. The maximum price is projected to be $0.000061, with an average price of $0.000055 throughout the year.
Pepe price prediction 2029
By 2029, the lowest predicted price for Pepe is $0.000067. It might reach a maximum price of $0.000082, with the average price expected to be around $0.000076.
Pepe price prediction 2030
Based on forecasts and technical analysis, the price of Pepe in 2030 is expected to start at a minimum of $0.000088. It could reach a maximum of $0.000099, with an average trading value of $0.000095.
Pepe price prediction 2031
Drawing from deep technical analysis of past PEPE data, the price in 2031 is projected to have a minimum value of $0.0001. The maximum price could reach $0.00019, with an average value of $0.00014 throughout the year.
Pepe price prediction 2032
By 2032, the lowest predicted price for Pepe is $0.00024. It might reach a maximum of $0.00035, with the average price expected to be around $0.00029.
PEPE price prediction 2026-2032
Pepe price prediction: Analysts’ forecast
Firm name
2026
2027
Coincodex
0.00001623
0.00001320
DigitalCoinPrice
0.0000105
0.0000148
Cryptopolitan’s Pepe price prediction
The significant influence of major announcements on Pepe’s market performance was demonstrated when its value rose by over 222% after being listed on the Binance exchange, achieving a record high. Another prominent event could similarly propel Pepe to unprecedented levels.
Cryptopolitan predicts that, in 2026, Pepe’s minimum expected price is projected to be $0.000002. It may peak at a maximum value of $0.000025, with an average trading price of $0.000015 throughout the year.
Initial Market Entry and Early Fluctuations: PEPE was introduced to the open market in May 2023, starting at $0.000001514. It experienced a peak at $0.000008117 in July 2023, followed by a dip to $0.0000006105 shortly after.
End of 2023 and Trends in 2024: By the close of 2023, the price of PEPE stabilized at $0.000001335. However, 2024 began with a downward trend, with the price dropping to $0.00001237 by mid-February.
Record High in March 2024: Amidst a surge in the memecoin sector, PEPE reached a new all-time high of $0.00001074 on March 14, 2024, but slightly decreased to $0.0000083 by March 21, 2024.
In May, the price of Pepe surged exponentially, and a new ATH was formed each week. On 27 May, Pepe price reached a new ATH at $0.00001718.
However, the price heavily declined in June as it broke below the crucial level of $0.00001.
In July, though the Pepe price touched $0.000012, it failed to maintain its momentum and dropped toward $0.0000093.
In August, Pepe’s price dropped toward the $0.0000058 level. However, it is now recovering slightly.
In September, the price of Pepe witnessed extreme fluctuation; however, it ended the month on a bullish note as it hit $0.000012.
Pepe price experienced an Uptober rally later as it surged toward the high of $0.000012 in October. However, the price is now declining below support channels.
In November, the price of Pepe skyrocketed above $0.000026.
In December, Pepe consolidated below $0.00002.
In January 2025, Pepe skyrocketed toward $0.000028, but it then declined to as low as $0.000010 in February.
Pepe price crashed in February as it dropped below $0.0000078.
In March, the price of Pepe declined heavily as it aimed for a low around $0.000005.
The price of Pepe attempted to surge above $0.00001 in April but it failed to meet buyers’ demand. This resulted in a bearish decline in the PEPE price chart. In early May, the price of Pepe skyrocketed toward $0.000013.
However, in early June, the price of Pepe declined toward the low of $0.00001. By June’s end, Pepe dropped toward $0.000009.
In July, PEPE price surged toward the high of $0.000015 but later declined below $0.00001 in early August.
By the end of August, the price of PEPE declined below $0.00001 again.
In September, PEPE price declined further toward $0.0000088.
The price of Pepe declined further in October and dropped toward $0.000005 in early November. By the end of November, the price of PEPE declined toward the low of $0.000004.
PEPE ended 2025 below $0.000004; however, it surged above $0.0000072 in early January.
By the end of January, the price of PEPE dropped toward $0.000004. In March, the price of PEPE declined toward $0.0000033.
In April, PEPE surged toward $0.000004. By the end of May, PEPE price dropped toward $0.0000034.
The OG meme coin has fared poorly over the past several months, dropping out of the elite top 10 crypto club.
While some market observers remain optimistic that a recovery could be on the way, recent whale behavior suggests that a deeper collapse is also plausible.
DOGE Whales ‘Paying Rent’
The popular analyst Ali Martinez revealed that 420 million coins have been distributed by such large investors over the past seven days. As of current rates, the USD equivalent of this stash is around $35 million, while whales now collectively own nearly 35 billion DOGE, 22.7% of the token’s circulating supply.
The development doesn’t guarantee that the meme coin’s price is headed for further decline, but it signals that these investors are preparing for such a scenario.
Some believe these market participants are experienced players who may have access to inside information, enabling them to position themselves effectively ahead of major moves. In any case, their actions are closely monitored by retail investors, who could follow suit, thereby intensifying the sell-off.
Others took a more humorous approach to explaining the recent behavior. X user Lynor, for instance, said that DOGE whales cashed out so they can “pay rent this week.”
Time to Rally?
Martinez has been quite vocal on DOGE lately, and his previous comments were quite optimistic. Earlier in June, he disclosed that the Tom DeMark Sequential indicator flashed a buy signal on the asset, suggesting a rebound could be on the way. It’s worth mentioning that this technical tool accurately predicted the meme coin’s pullback in early May, when the valuation dropped from $0.113 to $0.078.
Later on, the analyst paid special attention to $0.081, classifying it as “the lower mid-range boundary” of a five-year parallel channel dating back to 2021. He argued that holding above that level could open the door for another “parabolic move.”
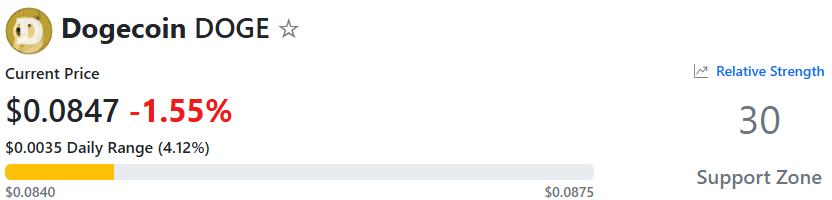
DOGE’s Relative Strength Index (RSI) supports the bullish scenario. The ratio has fallen to 30, meaning that the asset has entered oversold territory and could be due for a resurgence. The technical analysis tool ranges from 0 to 100, with anything above 70 considered a warning of a possible correction.
DOGE RSI, Source: RSI Hunter
Last but not least, we will take a look at DOGE’s exchange netflow. Over the past several weeks, outflows have surpassed inflows, reflecting a growing investor preference for self-custody – a trend that naturally reduces immediate selling pressure.
A leading crypto analyst has further expressed their confidence that Dogecoin could be set for a bullish run in the current market cycle. This comes thanks to renewed buyer interest in the coin following its recent drop.
Rising Volume Signals Strong Demand for Dogecoin
In an X post, Crypto analyst Emilio Crypto Bojan described the latest drop in DOGE as a “generational entry” point. According to Bojan, trading volume began rising soon after the coin hit its low point, suggesting that many investors bought the dip rather than selling.
The meme coin fell by about 14% to $0.07763 during last week’s high-volatility period, when Bitcoin fell to $59,000. Bojan considers this a perfect moment to buy this coin at a low price.
Since then, DOGE has recovered to around $0.08529. The coin has also maintained strong interest among traders, with a 24-hour trading volume of about $812.7 million and a market value of roughly $14.5 billion.
Analysts are now closely watching the $0.099 price level. This is seen as an important resistance point for Dogecoin. Bojan believes that if the meme coin can move above $0.099 and stay there, it could confirm that buyers have regained control of the market. He expects the cryptocurrency to “pump hard” after reclaiming that level.
Meanwhile, data from Santiment shows that wallets holding between 100 million and 1 billion DOGE have been reducing their holdings in recent weeks. These wallets now control 23% of Dogecoin’s circulating supply. The decline marks the lowest level in five months.
At the same time, wallets holding more than 1 billion DOGE, which are often associated with crypto exchanges, have increased their share of the circulating supply. Their holdings have risen to 47%, suggesting high activity among retail investors.
Bullish DOGE Sentiment Builds Up Among Analysts
Another analyst, Trader Tardigrade, recently pointed to a chart pattern that mirrors Dogecoin’s historic bull cycle. The analyst noted that the coin appears to be repeating the same sequence seen between 2014 and 2017, where the coin went through a long consolidation period, followed by a falling wedge formation and then a breakout.
During the previous cycle, DOGE rallied by an astonishing 29,000% after the pattern was completed. Trader Tardigrade believes the current market structure looks quite similar, raising expectations that another powerful move could be developing.
Adding to the bullish outlook, Ali Martinez noted that Dogecoin recently reached his target price of $0.0883. He said the meme coin is now testing the lower boundary of its current trading channel, which could determine its next move.
As long as the coin remains above this support level, the analyst believes a recovery toward $0.1019 and possibly $0.1156 remains likely. At press time, the coin was valued at $0.08522, according to data from CoinMarketCap.
The Shiba Inu (SHIB) price has remained under strong pressure this year as weak demand and fading market momentum continue to weigh on the meme coin. Beyond the price decline, new data now show that Shiba Inu’s Open Interest (OI) has crashed by more than 30%, while its burn rate has also slowed significantly. The decline in these key metrics points to weakening investor interest, lower trading activity, and reduced network engagement. Combined with Shiba Inu’s ongoing price struggles, these growing bearish signals have raised concerns about whether Shiba Inu is losing the strength that once made it the second-largest meme coin in the crypto market.
Shiba Inu Open Interest Crashes As Price Plummets
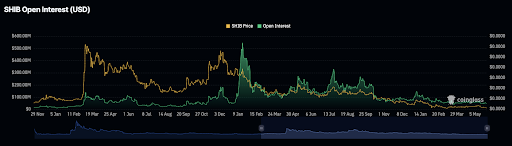
On May 27, data from Coinglass revealed that Shiba Inu’s Open Interest had dropped by 6% to $49.4 million, signaling weakness in futures activity and a decline in investor confidence in the meme coin. During the same period, Shiba Inu’s futures flow plunged by a staggering 190%, with outflows reaching $5.6 million, far exceeding the previous inflows of around $4.74 million.
Notably, this sharp decline pushed the net difference to $865,790 in total closed Shiba Inu contracts within 24 hours. The heavy outflow also wiped out roughly 156.56 billion SHIB tokens from the futures market, underscoring the ongoing decline in speculative trading activity.
Fast forward to today, Shiba Inu’s Open Interest has dropped an additional 5.6% to around $46.44 million. This suggests that traders are still closing positions at a rapid pace as bearish sentiment continues to dominate the market. The continued decline in leverage activity also reflects weakening sentiment among short-term investors, with many appearing unwilling to place strong bullish bets on SHIB’s near-term recovery.
This bearish shift comes as the meme coin’s price experiences prolonged volatility and market swings. According to CoinMarketCap’s data, Shiba Inu has been on a steady decline throughout this month. Its price has fallen by over 14% in the last 30 days and by more than 63% year-to-date.
At the time of writing, the meme coin remains in the red, with its recent price correction driven by increased selling pressure and a drop in Bitcoin’s price. Other factors contributing to SHIB’s low price are the broader weakness in the meme coin market, which has also affected coins like Dogecoin (DOGE).
SHIB Burn Rate Dwindles To Surprising Lows
Another metric that has surprisingly taken a hit is Shiba Inu’s burn rate. According to the meme coin’s burn tracker, Shibburn, just $2 worth of SHIB tokens were burned on May 26, highlighting a sharp slowdown in activity and adding more pressure to the already bearish market.
Notably, the Shiba Inu ecosystem is widely known for conducting large-scale token burns, with many community members believing that a continued decline in supply could create sufficient scarcity to support a future price explosion. However, recent on-chain reports now show that this usually active burn mechanism has taken a pause.
Shibburn also revealed that only about $11 worth of tokens were burned over the last 24 hours, representing just over 2.05 million SHIB. In the past week, less than $100 worth of tokens was removed from circulation, indicating weakening interest in the meme coin and a clear lack of interest in helping reduce SHIB’s supply.
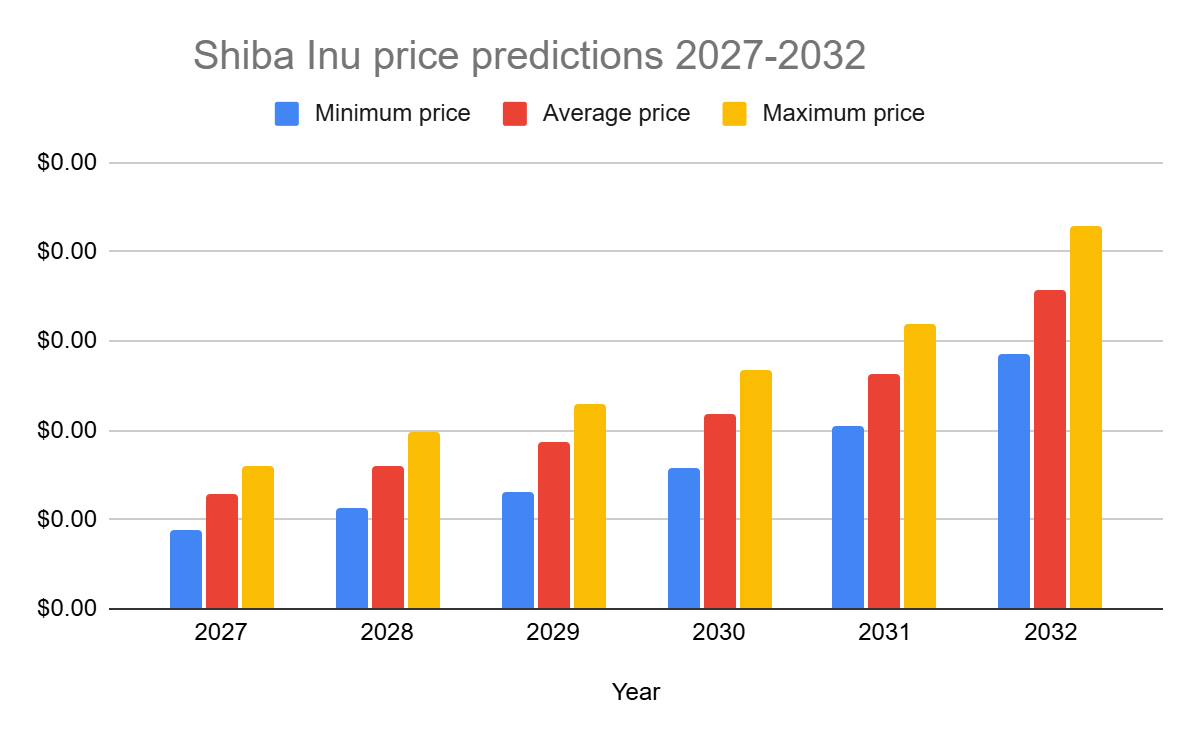
In 2026, the Shiba Inu coin price prediction suggests a maximum value of $0.00001775.
In 2029, SHIB is expected to reach a maximum value of $0.00002290.
The price of Shiba Inu is predicted to reach a maximum value of $0.00004280 in 2032.
Shiba Inu (SHIB) was initially launched as a meme coin with ambitions to surpass Dogecoin’s popularity and market presence. Over time, Shiba coin has continued to expand its ecosystem through Shibarium, ShibaSwap, and new utility-driven updates. Recent developments show growing activity as the team launched “Shib Owes You” (SOU), introduced AI tools through “Shibarium Skills,” and addressed RPC connection issues affecting users.
At the same time, SHIB gained real-world utility after integrating with OnePay, a payment network backed by Walmart. Shibarium also surpassed 270 million wallet addresses, showing steady adoption and increasing on-chain activity.
As Shiba Coin’s ecosystem grows, questions arise about SHIB’s market capitalization and its price trajectory. How much will Shiba Inu be worth in the coming years? Will the advancements drive SHIB to new highs and impact the market’s price action?
Will SHIB ever reach $1? In this Shiba Inu price prediction, analyzed by Cryptopolitan, we’ll determine future SHIB price trends between 2026 and 2032.
Today, SHIB price analysis shows a bearish pressure toward $0.0000056
The current resistance for SHIB is at $0.0000060
The immediate Support for SHIB is at $0.0000053
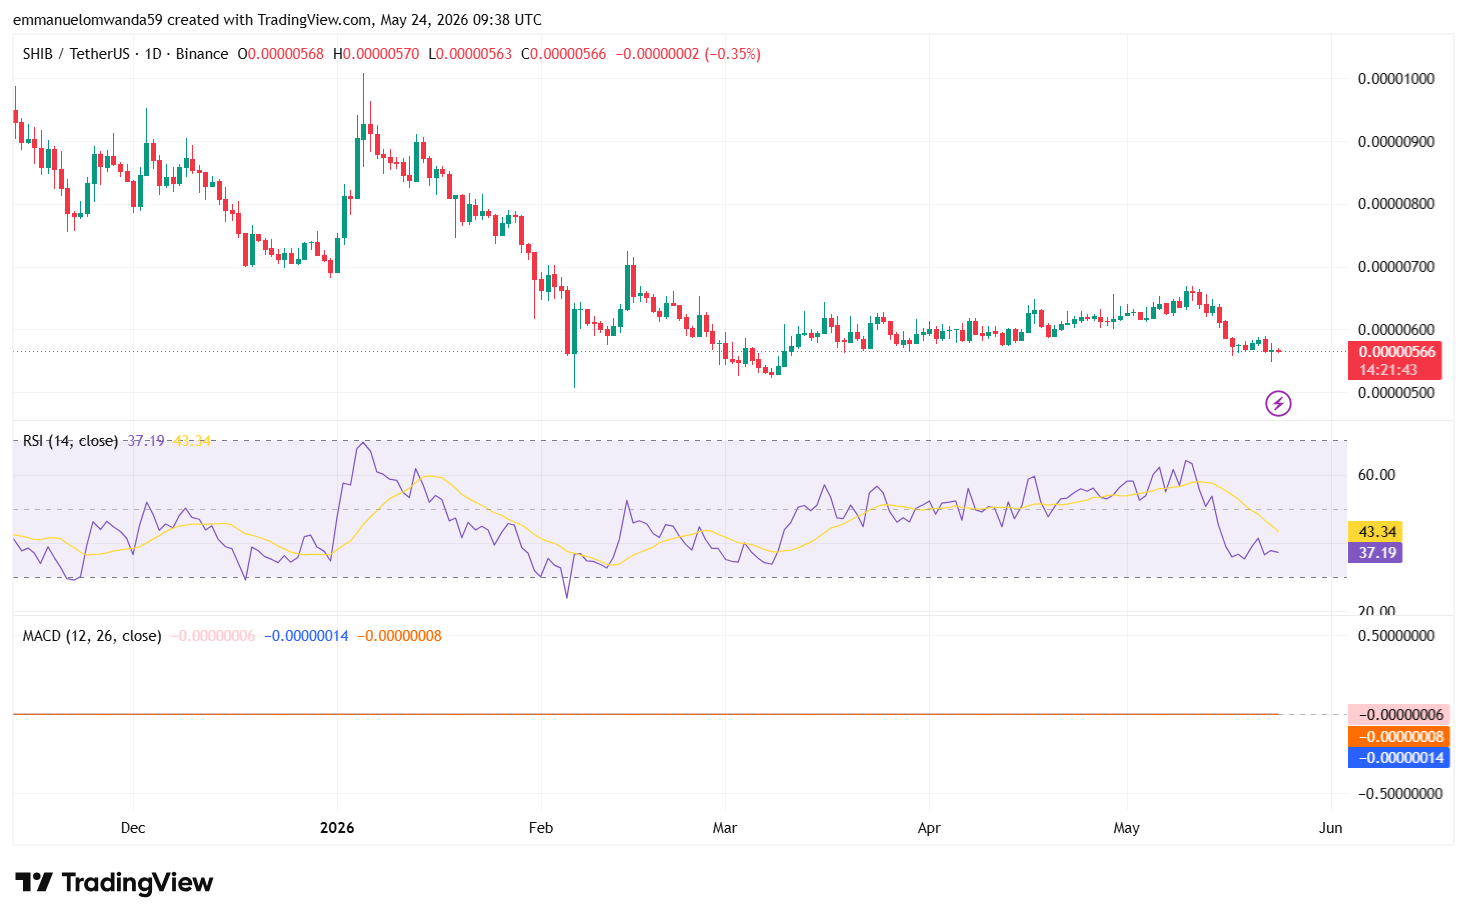
The SHIB price analysis for 24 May 2026 shows that SHIB continues to face selling pressure as the meme coin declines toward $0.0000056. Currently, sellers are attempting to maintain bearish momentum after recent rejection near higher resistance levels.
Analyzing the daily chart, it is clear that the SHIB price is facing bearish pressure as sellers push it toward $0.0000056. On the daily chart, SHIB opened at $0.00000568, climbed to a high of $0.00000570, dropped to a low of $0.00000563, and closed near $0.00000566. The token declined by around 0.35% in the last 24 hours, showing weakening bullish momentum.
The 24-hour trading activity remained subdued, reflecting cautious sentiment among traders as SHIB struggles to recover above immediate resistance channels. Price action suggests bears are attempting to hold the token below $0.0000058, while buyers defend the key support zone around $0.0000053.
The RSI-14 trend line has dropped below the neutral zone and trades at 37.19, indicating that sellers are currently controlling market momentum. The declining RSI curve also hints at weak buying strength and the possibility of continued consolidation or downside movement in the short term.
The MACD indicator remains in bearish territory, with the MACD line trading below the signal line and red histograms forming, confirming negative momentum and strengthening bearish sentiment on the daily timeframe.
The Immediate resistance for SHIB is at $0.0000060, while strong support is forming near the $0.0000053, where buyers may attempt to prevent further downside pressure.
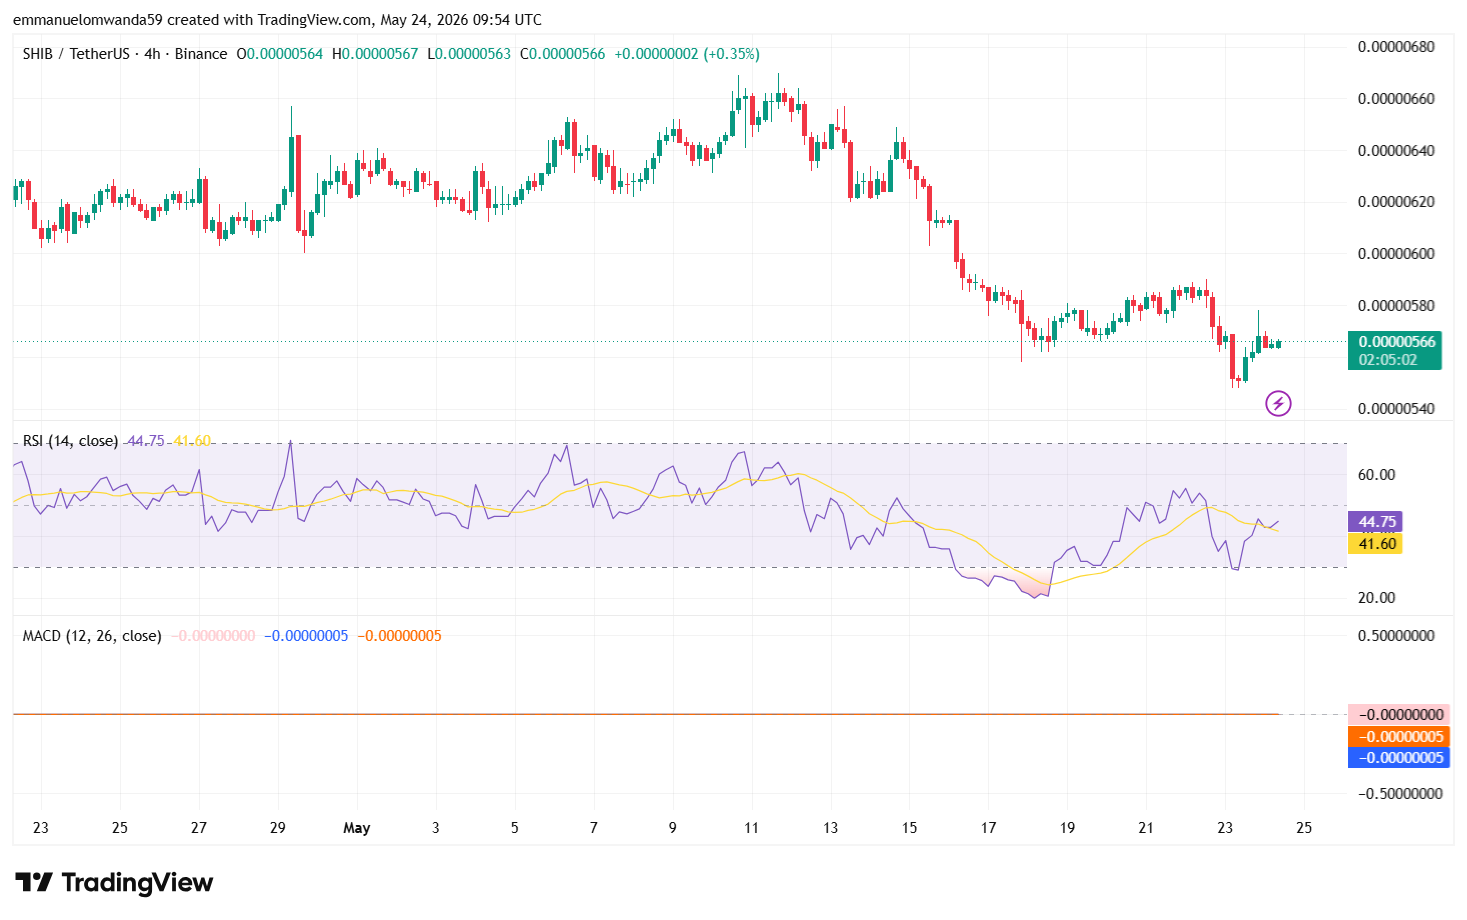
Analyzing the 4-hour SHIB price chart, it shows that sellers continue dominating the short-term trend as SHIB struggles to recover above immediate resistance levels. Price action shows continued weakness below the EMA trend lines, with bears attempting to maintain pressure around the $0.0000056 region.
The RSI-14 indicator trades around 44.7, showing that bearish momentum is easing slightly, though buyers still lack enough strength for a strong breakout. The RSI curve is attempting to recover from oversold conditions, hinting at a possible short-term consolidation if buying activity improves.
The BoP indicator remains in a slightly negative region, suggesting sellers are still controlling short-term momentum near support zones. Additionally, the MACD trend line continues forming weak red histograms below the signal line, indicating that bearish momentum remains active on the 4-hour timeframe.
Immediate resistance on the 4-hour chart is positioned near $0.0000058, while support is forming around the $0.0000054 level.
Shiba Inu technical indicators: Levels and action
Daily simple moving average (SMA)
Period
Value
Action
SMA 3
$0.000005731
BUY
SMA 5
$0.000005756
SELL
SMA 10
$0.000006053
SELL
SMA 21
$0.000006196
SELL
SMA 50
$0.000006103
SELL
SMA 100
$0.000006026
SELL
SMA 200
$0.000007082
SELL
Daily exponential moving average (EMA)
Period
Value
Action
EMA 3
$0.000005758
SELL
EMA 5
$0.000005816
SELL
EMA 10
$0.000005961
SELL
EMA 21
$0.000006084
SELL
EMA 50
$0.000006122
SELL
EMA 100
$0.000006370
SELL
EMA 200
$0.000007345
SELL
What to expect from the SHIB price analysis next?
SHIB may continue trading under bearish pressure in the short term unless buyers push the price above the immediate resistance near $0.0000058. If sellers maintain control and SHIB breaks below the $0.0000054 support zone, the meme coin could see a deeper correction toward lower support levels.
Is Shiba Inu a good investment?
Shiba Inu (SHIB) is currently consolidating between key support and resistance. A breakout above resistance could lead to gains, while failure to hold support may cause further downside. SHIB may suit investors comfortable with volatility, but it’s important to monitor price action closely before making any investment decision.
Why is Shiba Inu down today?
SHIB recently declined as broader macro risk-off conditions triggered heavy selling across meme coins, with investors moving away from speculative assets amid rising inflation and Treasury yields. The downturn was intensified by large SHIB exchange inflows, bearish technical breakdowns below key support levels, and increased selling pressure from short-term traders.
Recent news on Shiba Inu
Shiba Inu (SHIB) has been included in SBI VC Trade’s “Rent Coin” lending program in Japan, offering yields of around 2% to 5% APY over a ~28-day term. The move follows SHIB’s addition to Japan’s Green List, reinforcing its status as a regulated asset and expanding its use into lending and passive income services.
SHIB included in SBI VC Trade lending expansion in Japan
SBI VC Trade continues its “Rent Coin” lending program with Shiba Inu officially listed among supported assets. The latest campaign confirms SHIB remains part of their active lending lineup.
More than 1.1 trillion SHIB tokens moved on-chain recently over the last 24 hours as whale activity intensified, while exchange reserves dropped to nearly 81 trillion SHIB, the lowest level seen in 2026 so far. Large holders continued moving tokens away from centralized exchanges into private wallets, signaling possible accumulation despite calm price action across the broader market.
SHIB Whales Just Moved 1.1 Trillion Tokens as Exchange Supply Hits 2026 Low
More than 1.1 trillion SHIB moved on-chain in the last 24 hours as whale activity accelerated behind the scenes.
At the same time, exchange reserves dropped to around 81T SHIB, the lowest level recorded… pic.twitter.com/BTsovUIQgo
Shiba Inu’s network activity continued expanding as the total holder count climbed to over 1.58 million wallets, while exchange reserves remained near yearly lows at 81.31 trillion SHIB. Recent on-chain data also showed sustained exchange outflows and negative netflows of over 452 billion SHIB, signaling continued accumulation behavior despite subdued market trading activity.
SHIB Market Snapshot
SHIB holder count has climbed to 1,585,249 wallets, continuing the steady expansion of the network while exchange reserves remain near yearly lows.
Latest exchange data: • Total Exchange Reserve: 81.31T SHIB • Total Exchange Netflow: -452.72B SHIB • 7D…
Yes, according to crypto experts’ long-term predictions, SHIB’s role in the cryptocurrency market is projected to lead it to reach $0.00005 behold 2032.
Will SHIB reach $100?
SHIB’s goal of reaching $100 is virtually impossible given its vast circulating supply in the meme coin market, which significantly influences its price movements. Additionally, to get the $100 mark, SHIB would require a significant increase in its market cap, which is beyond imagination for a meme coin.
Does SHIB have an excellent long-term future?
The Shiba Inu price made headlines in January 2025 after Shytoshi Kusama, the lead developer, stepped down. However, SHIB shows some positive movement, suggesting the ecosystem may have a promising long-term future.
However, its success will also depend on macroeconomic factors, partnerships, broader market adoption trends, and other regulatory developments that influence market cycles. You are advised to seek investment advice, do your own research, and gather expert opinions before investing in the highly volatile crypto market.
Shiba Inu price prediction for May 2026
The Shiba Inu price forecast for May 2026 is expected to range from $0.00000560 to $0.000007757. The average price for SHIB is projected to be around $0.00000668, assuming a gradual recovery and moderate buying interest.
Month
Potential low
Potential average
Potential high
May 2026
$0.00000560
$0.00000668
$0.000007757
Shiba Inu price prediction 2026
The shiba inu cost in 2026 is predicted to range from a minimum of $0.000005173 to a maximum of $0.000027, with an average price of $0.000016086. The Shiba Inu price prediction for 2026 suggests a potential high of $0.000027 and a low of $0.000005173.
Year
Potential low
Potential average
Potential high
2026
$0.000005173
$0.000016086
$0.000027
Shiba Inu price predictions 2027-2032
Year
Minimum price
Average price
Maximum price
2027
$0.00000890
$0.00001280
$0.00001610
2028
$0.00001140
$0.00001590
$0.00001980
2029
$0.00001320
$0.00001870
$0.00002290
2030
$0.00001580
$0.00002190
$0.00002680
2031
$0.00002040
$0.00002630
$0.00003190
2032
$0.00002860
$0.00003570
$0.00004280
Shiba Inu Price Prediction 2027
In 2027, the price of Shiba Inu is projected to reach a minimum level of $0.00000890. The SHIB price could rise to a maximum of $0.00001610, with an average trading price of $0.00001280 as the market gradually recovers and the ecosystem grows.
Shiba Inu Price Prediction 2028
The price of Shiba Inu is expected to reach a minimum level of $0.00001140 in 2028. The SHIB price could climb to a maximum level of $0.00001980, with an average price of $0.00001590 throughout the year.
Shiba Inu Price Prediction 2029
In 2029, the price of Shiba Inu is predicted to reach a minimum level of $0.00001320. The SHIB price could reach a maximum level of $0.00002290, with an average trading price of $0.00001870.
Shiba Inu Price Prediction 2030
In 2030, Shiba Inu is forecast to trade at a minimum value of $0.00001580. The price could reach a maximum of $0.00002680, with an average trading value of $0.00002190.
Shiba Inu Price Prediction 2031
In 2031, the price of Shiba Inu is expected to reach a minimum value of $0.00002040. The SHIB price could reach a maximum value of $0.00003190, with an average value of $0.00002630.
Shiba Inu Price Prediction 2032
Shiba Inu price is forecast to reach a lowest level of $0.00002860 in 2032. The SHIB price could reach a maximum level of $0.00004280, with an average forecast price of $0.00003570.
Our predictions show that the Shiba Inu cryptocurrency will achieve a minimum value of $0.00000545 in 2026. The Shiba Inu price could reach a maximum value of $0.00001775, with an average trading price of $0.00001160 throughout 2026. Please note that the content provided and other content on this page are for informational purposes only and do not constitute investment advice. Seek independent professional consultation or do your research.
Shiba Inu historic price sentiment
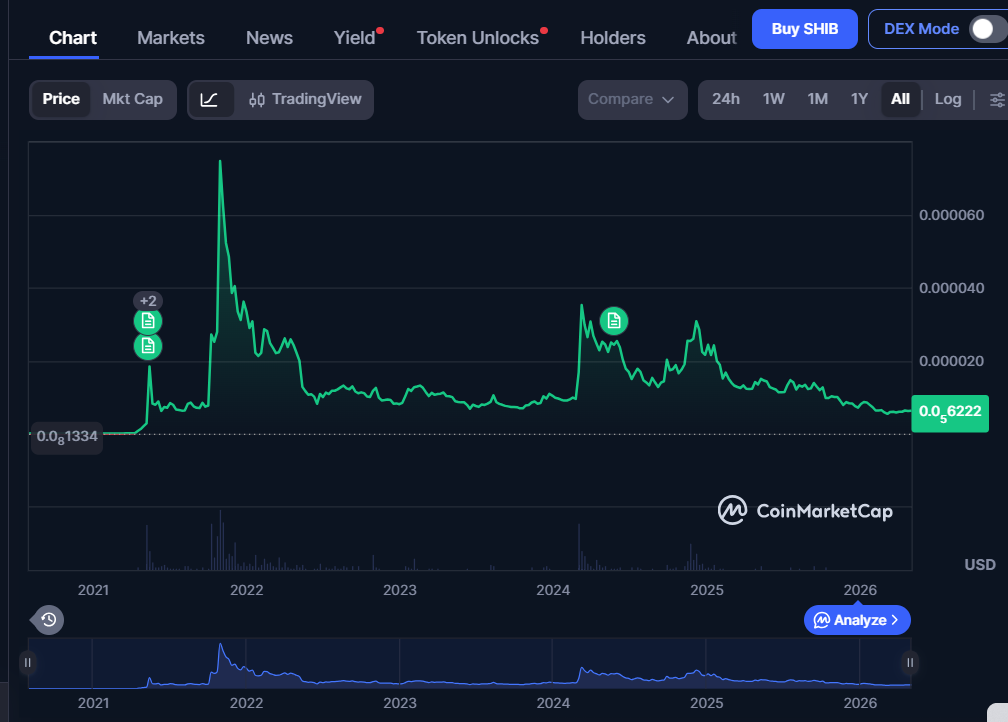
Shiba Inu Price History: Coinmarketcap
Shiba Inu surged over 300% shortly after launch, triggering a trading frenzy similar to Dogecoin’s early 2021 rally. During this period, many investors rushed to buy SHIB on easy-to-use platforms as its popularity surged and exchanges quickly listed the token to meet demand.
Shiba Inu’s price action has been marked by significant volatility, with sharp spikes and corrections driven by community hype, market sentiment, and broader crypto trends.
In 2022, SHIB started near $0.000025 but dropped to around $0.000008 by May, then moved between $0.000007 and $0.000010 for the rest of the year.
In early 2023, Shiba Inu briefly spiked to $0.000015 in February but declined gradually, stabilizing around $0.000010 by June 2023 and closing the year at $0.00001033.
In March 2024, SHIB climbed to $0.000045 before consolidating between $0.000017 and $0.000029. By late 2024, the price moved between $0.000015 and $0.000033.
In 2025, SHIB gradually declined from $0.000021 to below $0.000009 by December, despite brief rebounds during the year.
In early 2026, SHIB briefly recovered to $0.0000098 in January but fell to the $0.0000065 range in February.
In January 2026, Shiba Inu jumped from about $0.0000087 to near $0.0000098 before pulling back and stabilizing around $0.0000093.
As of February 2026, Shiba Inu (SHIB) experienced volatility, fluctuating between approximately $0.0000065 and $0.0000068, with short-term rebounds failing to sustain upward momentum.
At the start of March 2026, Shiba Inu (SHIB) remained under pressure, trading around $0.0000054 after slipping from the February range.
Shiba Inu (SHIB) experienced a bullish momentum on March 16, 2026, with the price rising 8% in 24 hours to approximately and over 17% for the week.
By the end of March 2026, Shiba Inu (SHIB) traded at around $0.0000058 after failing to sustain recoveries from mid-month gains.
By mid-April 2026, Shiba Inu (SHIB) traded around $0.0000061, showing slight stabilization after recovering from the early March range, though buying momentum remained limited.
At the start of May 2026, Shiba Inu (SHIB) traded around $0.0000062, moving in a tight range with slight consolidation, as the market showed weak momentum and no strong buying pressure.
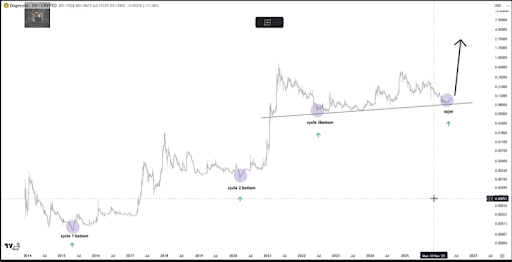
Dogecoin’s next major move may depend less on hype and more on exhaustion. A new technical analysis from crypto analyst Cryptollica proposes that the leading meme coin is now trading at another cycle-bottom zone, and the weekly chart is showing the same kind of RSI washout and long compression that previously appeared before notable Dogecoin rallies.
Dogecoin’s Fourth Cycle Bottom Comes Into View
Dogecoin has spent the better part of the past year being written off. Sentiment has collapsed, price has compressed, and the crowd that once celebrated the meme coin has gone silent. However, a structure that has correctly identified every major Dogecoin bottom since 2015 is saying this is precisely the moment worth watching.
This structure analysis in question is built around the idea that Dogecoin’s chart is not only a price chart but also a record of market cycle psychology. According to analyst Cryptollica, the 2015 bottom was a period of disbelief, the 2020 bottom was boredom, and the 2022 bottom was anger. This makes the current setup the fourth cycle bottom, where sentiment appears exhausted while the bullish structure is resetting.
The weekly chart shared by the analyst shows Dogecoin moving along a long-term rising support structure, with each major low forming during a period when the weekly RSI dropped into or near oversold territory. Interestingly, the latest RSI reading shown on the chart shows the Dogecoin price bouncing from that RSI in early 2026 and slowly trending upwards.
Where The Structure Says The Bottom Is
Dogecoin is currently looking like it is registering a bottom around $0.10. However, the most important point in this analysis is that timing the Dogecoin bottom is not confirmed by price alone. Timing the Dogecoin bottom comes from a combination of three things: an oversold weekly RSI, long compression, and price holding around the cycle support zone.
The first signal is already visible in the chart. Dogecoin’s weekly RSI has fallen into the same region as previous cycle lows. The second signal is compression. Dogecoin has spent months grinding through a wide base around $0.10 instead of moving in a clean upward trend. That may look weak on the surface, but in cycle analysis, extended compression often means sellers are losing control gradually.
The third signal is confirmation. In order for the bottom argument to become stronger, Dogecoin would need to hold the current support region at $0.10 and begin forming higher lows on the weekly chart. A move back above the nearest major resistance zones at $0.15 and $0.2 would add more weight to the claim that the cycle bottom has been made.
That means $0.10 is now one of the most important areas for the Dogecoin price. If the fourth cycle bottom is confirmed, then the question changes from where Dogecoin is now to how it has rallied from similar structural positions. Cryptollica’s analysis points to a top target above $2. At the time of writing, Dogecoin is trading at $0.104, back to retesting $0.10 from an intraday high of $0.1126.
Dogecoin is facing a confusing technical setup as technical analysis warns of a major higher-timeframe move that could first send DOGE into a deeper accumulation zone. The chart appears bearish at first glance, but the inverted price scale changes the reading, turning the projected drop into a longer-term bullish setup that points to $1, $2, and eventually $5.
Dogecoin Is Approaching Its Smart Money Zone
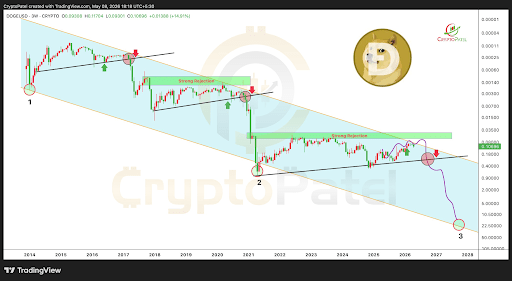
Technical analysis done by a crypto analyst known as Crypto Patel is built around the idea that Dogecoin may still need to push lower before its larger upside cycle begins. Crypto Patel’s 3-week DOGE/USD chart on TradingView covers over a decade, from 2014 to a projected 2028, and it shows repetitive price action. The key detail, however, is that the chart is inverted for emphasis, meaning the bearish-looking projection actually points to a bullish long-term move.
The chart shows Dogecoin inside a descending channel that has guided the price for years. The first major phase began with a rejection at the upper trendline before the 2017 cycle, followed by a large move that eventually gave way to another long correction. A second major base formed around early 2021, which later led to Dogecoin’s explosive run during the last meme coin mania.
Crypto Patel appears to be comparing the current structure to those earlier phases. The third setup on the chart is developing right now, where Dogecoin looks like it is rejecting at the upper trendline of the descending channel.
What’s Next For Dogecoin?
The marked rejection zone around the current area shows that the Dogecoin price could still revisit as low as $0.07 in the accumulation range for a bottom before a strong higher-timeframe reversal. According to Crypto Patel, retail traders will sell the bottom, but smart money traders are already setting alerts.
Interestingly, on-chain data support this notion of smart money movements and whales that are accumulating Dogecoin. Recent on-chain data in early May shows that Dogecoin whales recently recorded their busiest day in six months, and most of this activity is accumulation moves.
If Dogecoin breaks below the current range without strong spot demand, the move could still drag the price deeper into Crypto Patel’s $0.10 to $0.07 accumulation band. However, the projection shows the Dogecoin price reversing around the accumulation band and embarking on a rally, with the analyst pointing at $1, $2, and $5 targets.
Crypto Patel’s $1, $2, and $5 targets are very bullish, especially because Dogecoin is down by 85% from its 2021 all-time high of $0.7316.
At the time of writing, Dogecoin is trading at $0.109. The first major checkpoint would be confirming daily and weekly closes above $0.10, reclaiming higher resistance levels around $0.15 to $0.20, and confirming that the current structure has moved out of a long corrective phase.
Pump.fun traders, after a long stretch of weak performance, are beginning to see a clear turnaround in 2026, according to fresh data from CoinGecko.
Between April 2024 and late 2025, most traders exiting positions on the popular Solana-based meme coin platform ended each month with losses. During this period, the share of profitable wallets rarely crossed the 50% mark and fell as low as 30.1% in June 2025, amid significant underperformance among active participants.
Pump.fun Profitability Improves
The trend began to reverse in early 2026. In February, Pump.fun recorded almost 57% of traders in profit, followed by a sharp rise to 70% in March and 73.3% in April 2026. In April 2026, profits were heavily concentrated at the lower end of the spectrum.
CoinGecko found that the largest cohort, about 2.05 million wallets or 65.1%, earned between $1 and $500. Another 87,000 wallets, or 2.8%, made between $500 and $1,000, while 169,000 wallets, representing 5.4%, booked gains above $1,000.
On the loss side, 793,000 wallets, or around 25%, lost between $1 and $500, while 22,000 wallets (0.7%) lost $500 to $1,000, and 24,000 wallets (0.8%) saw losses of more than $1,000. The data indicated that both gains and losses are largely clustered in small amounts, which “reflects the small-size, high-frequency nature of memecoin trading, where participants typically deploy small amounts of capital.”
The report also noted that the improvement in profitability may be tied to a shakeout of weaker participants, as monthly active wallets fell from a peak of 5.2 million in May 2025 to 1.8 million in December 2025. The subsequent recovery in early 2026 points to a smaller but potentially more experienced trader base returning to the platform.
“This decline can be seen as the exit of the broader retail crowd and subsequent recovery in wallet counts from early 2026 onward implies the return of a more selective, experienced trader base, naturally shifting the profitability distribution in their favour.”
Token Policy Change
Last week, Pump.fun announced it had burned all previously repurchased PUMP tokens and introduced a new buyback-and-burn program funded by 50% of future net revenue. The project said the burned tokens were worth about $370 million and represented 36% of the circulating supply.
It added that, facing trust issues over the longevity of its business, the certainty of buybacks, and how repurchased tokens would be used. According to Pump.fun, the move was meant to address uncertainty through a community-first approach going forward.
A single Solana wallet lost about $150,000 buying Scam Altman (SCAM) near the top of its launch. The trader sold close to the bottom after SCAM crashed 95% in 24 hours, on-chain analytics firm Bubblemaps reported.
The same address, tagged AuKRRB…L7sN, also dropped roughly $81,000 on UNC and $14,000 on ASTEROID in earlier trades. The three-token streak put combined realized losses at about $245,000 in a single week.
How the Scam Altman Trade Went Wrong
The Scam Altman token launched on Pump.fun this week as Elon Musk’s lawsuit against Sam Altman and OpenAI opened in federal court in Oakland.
Musk spent much of the morning calling the OpenAI chief “Scam” Altman across multiple X posts. Solana traders read the nickname as a tradable meme and raced to mint a token before competitors could.
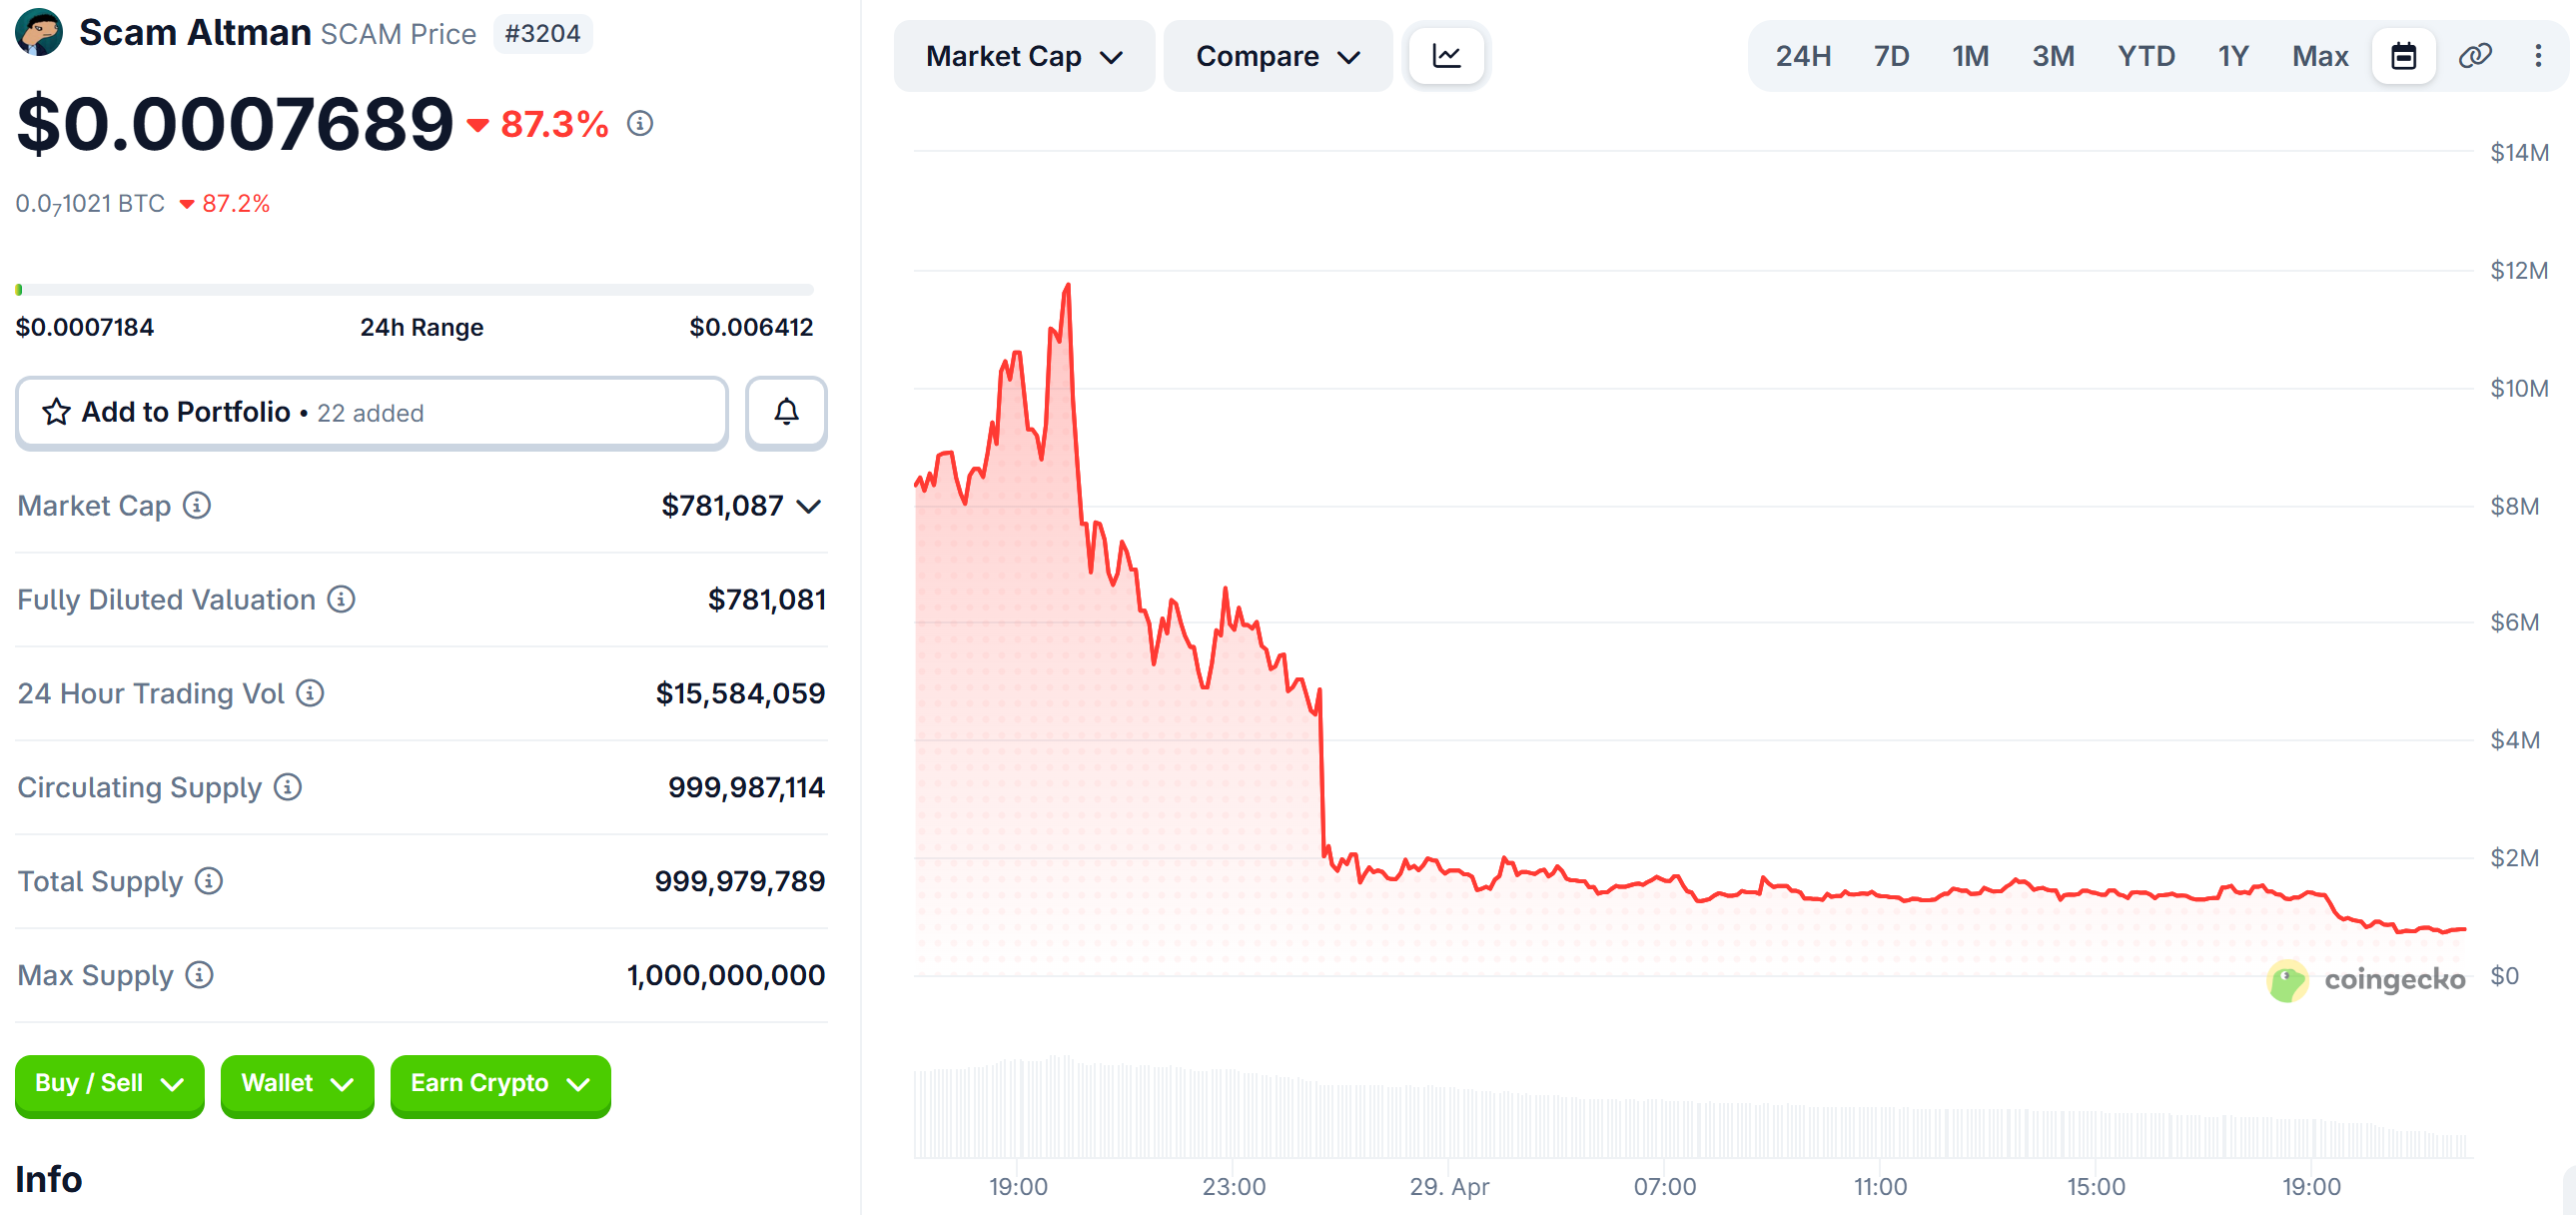
Within eight hours, SCAM hit a market cap above $10 million on roughly $19.6 million of volume. The peak briefly approached $20 million before sellers stepped in.
The reversal was equally fast. SCAM shed close to 88% of its value over the next 24 hours. The drop from the highlighted wallet’s entry to its exit reached about 95%.
What Bubblemaps Showed
Bubblemaps shared a post with a visualization of SCAM holders that flagged clusters of interconnected wallets. That pattern often signals insider distribution or coordinated buying on Solana meme coin launches.
Having a bad day?
This guy lost $150k yesterday buying $SCAM right before it dumped -95%.
The map placed wallet AuKRRB…L7sN inside an active buyer cluster near the top of the chart. Bubblemaps shared a direct map so traders could inspect the wallet relationships themselves.
The same trader’s earlier picks tell a similar story. Wallet AuKRRB…L7sN bought UNC and ASTEROID after each token had already pumped, suggesting late-entry timing on Solana tickers.
A Familiar Pump.fun Cycle
Tokens launched on Pump.fun rarely survive a full trading week. Galaxy Research has argued the meme coin economy rewards bots and snipers, while retail traders absorb most of the losses.
❌ Las memecoins NO hacen ricos a los traders…
Esto es lo que dice el último informe de Galaxy Research, que resalta que los que ganan son las plataformas como Pump fun, los DEX y los bots 🫠
Industry compliance figures put Solana rug pull losses at roughly $500 million in 2024 alone.
SCAM followed the familiar template. A hype-driven launch attracted retail buyers, early holders distributed into the demand, and the chart collapsed within hours.
The token had no whitepaper, no team, and no product. Its only narrative was Musk’s recurring nickname for Sam Altman during the OpenAI trial.
Sam Altman’s existing crypto venture, Worldcoin (now rebranded as World), had no connection to SCAM. The meme coin was an unaffiliated joke trade riffing on the courtroom drama.
Whether SCAM stabilizes or fades will likely depend on how long the Musk and Altman feud dominates crypto X. For the trader behind AuKRRB…L7sN, the bill has already arrived.