Ethereum Price Analysis: ETH Looks Ready to Rally – But Is a Pullback Coming First?
Ethereum’s breakout past its descending trendline signals structural strength for institutional buyers, but a pullback to support zones between $2.07K and $2.21K is technically likely after the asset’s near-vertical rally from $1.87K to $2.55K. How the asset behaves at these support levels will determine whether the broader bull structure holds or gives way to deeper losses.
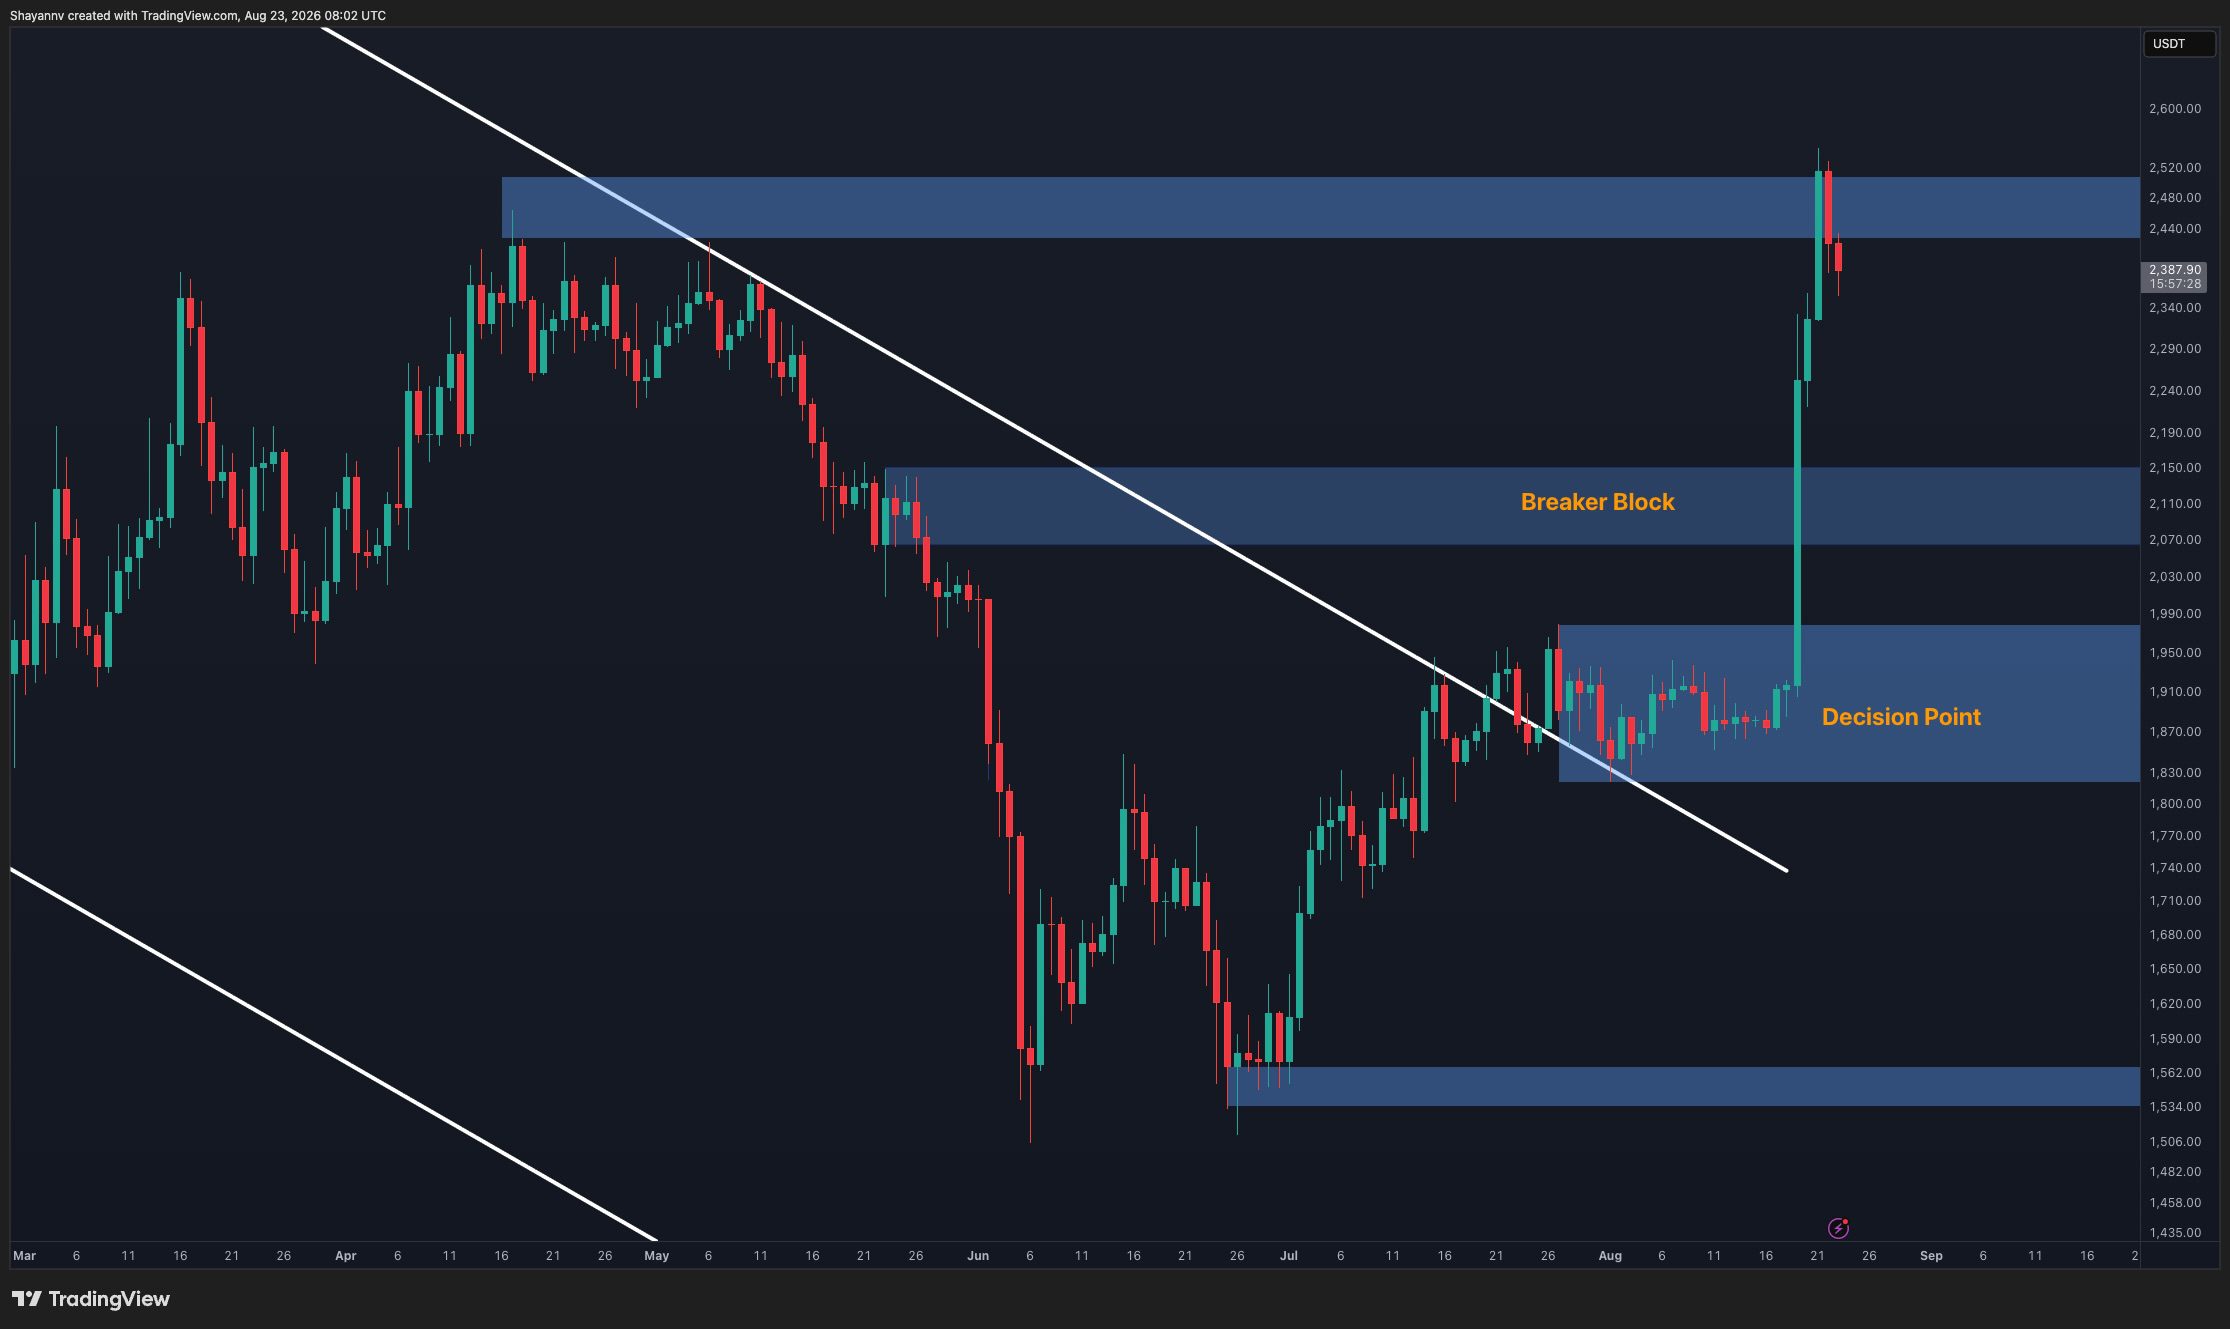
- Ethereum rallied from $1.87K to $2.55K in just a few sessions, then pulled back to $2.39K after hitting major resistance.
- The $2.07K-$2.15K support zone sits at a critical confluence of Fibonacci levels (0.618 and 0.702 retracements) on the 4-hour chart.
- Liquidation liquidity concentrated above $2.2K suggests the correction may extend further before buyers step in decisively.
- $2.55K Ethereum’s recent high before pullback began
- $1.87K-$2.39K Range of current consolidation versus prior breakout entry point
- $2.07K-$2.15K Critical support zone underpinning the bullish structure
Ethereum has broken decisively through a long-standing descending trendline that had constrained the market for months, marking a structural shift in favor of buyers on the daily timeframe. The rally cleared two major resistance zones, the $1.83K-$1.97K decision point and the $2.07K-$2.15K breaker block, before reaching the $2.44K-$2.51K resistance area where sellers emerged.
ETH briefly touched $2.52K before retreating to around $2.39K, a pullback that follows the kind of near-vertical advance typically followed by consolidation or deeper correction. The speed and magnitude of the move have created a technical scenario where near-term volatility is likely, even as the broader breakout structure remains intact.
Ethereum Clears Months-Old Resistance After Rally From $1.87K
The daily chart reveals the scope of Ethereum’s structural momentum. The asset consolidated for an extended period in the $1.83K-$1.97K zone before launching higher with conviction.
The decisive break of the descending trendline that had capped previous rallies represents a material shift in market structure, the kind of breakout that institutional traders use to reset their conviction and position sizing.
What followed was a rapid extension through the $2.07K-$2.15K breaker block, historically a zone that had absorbed selling pressure on prior attempts. The lack of hesitation at this level suggested fresh demand stepped in, allowing the market to reach the major $2.44K-$2.51K resistance cluster.
That these price levels now face rejection matters less than the fact that Ethereum’s traders have confirmed the descending trendline is no longer a ceiling, a technical fact that persists even as the market consolidates or corrects.
For institutional investors tracking structural shifts, the breakout past the trendline establishes a floor under conviction. As long as the $2.07K-$2.15K support zone holds, the breakout framework remains valid, meaning any pullback should be viewed as a tactical opportunity rather than a reversal of the broader trend.
Fibonacci Confluence at $2.07K-$2.15K Creates Strong Support Cluster
The 4-hour timeframe offers crucial detail for timing a potential re-entry or confirming the durability of support. Ethereum’s surge from $1.87K to the $2.55K peak occurred in only a few trading sessions, an outsized move that historically precedes either consolidation or pullback to retest lower levels.
On the 4-hour chart, the Fibonacci retracement levels provide a technical framework for where that pullback might find buyers.
The 0.5 retracement sits near $2.21K, while the 0.618 retracement aligns with $2.13K, a level that sits directly inside the $2.07K-$2.15K support zone identified on the daily chart. Adding further weight to this cluster, the 0.702 retracement also clusters near $2.07K, creating a confluence of three technical levels across a tight $800 range.
This kind of clustering is precisely what institutional traders use to size positions and set stop levels; it represents a zone where the probability of a reaction from sellers becomes statistically elevated.
If the pullback extends through the $2.21K level but finds support in the $2.07K-$2.15K zone, the corrective phase would remain consistent with a normal pullback after an impulsive rally. A reaction from this region would preserve the bullish breakout structure and position the market for another attempt at the $2.44K-$2.55K resistance area.
A decisive break below $2.07K, however, would weaken the daily setup and expose deeper levels around $2.01K (the 0.786 retracement), shifting the technical narrative toward weakness.
Liquidation Clusters Signal Deeper Pullback May Extend Below $2.2K
The one-week Ethereum liquidation heatmap adds a crucial data layer to the pullback scenario.
Following the rapid rally, a notable concentration of liquidation liquidity has developed above current levels, particularly in the zone above $2.2K. This cluster of stops and liquidation orders can act as a liquidity magnet, potentially drawing the price lower as sellers test for weak long positions accumulated during the explosive advance.
For institutional traders, liquidation maps provide insight into where algorithmic selling and cascading stops might trigger further downside.
A market structure in which liquidation is stacked above current prices creates asymmetric risk; the market may be more likely to visit lower levels than to push higher immediately, as the act of moving down triggers forced selling that accelerates the pullback. This dynamic is particularly relevant after a move as steep as Ethereum’s $1.87K-to-$2.55K surge.
The presence of heavy liquidation clustering above $2.2K suggests the pullback could extend into the $2.07K-$2.21K support zone before finding a floor. This outcome would not invalidate the breakout; rather, it would represent the normal cooling phase after an impulsive advance.
The critical question is whether support holds at the confluence zone, or whether the pullback extends to $2.01K and threatens the integrity of the daily breakout structure.
Key Support Levels Define the Next Phase of Ethereum’s Rally
The technical setup facing Ethereum investors hinges on two nested decision points. In the immediate term, the $2.21K level (the 0.5 Fibonacci retracement) will act as the first tactical filter. A bounce from this level would suggest the pullback is limited and that buyers remain in control of the structural narrative.
Failure to hold $2.21K directs attention to the critical $2.07K-$2.15K confluence zone, where the interaction between price and the three-level Fibonacci cluster will determine whether the broader breakout survives.
For institutional portfolio managers and hedge funds, the near-term decision tree is straightforward: positions established after the trendline break should be sized with stops below the $2.07K support zone, as a break below this level would materially weaken the case for continuation.
Conversely, a reaction from the $2.07K-$2.15K zone would restore bullish momentum and provide a foundation for testing the $2.44K-$2.55K resistance area once again.
The next 48 to 72 hours will likely test whether Ethereum can defend the $2.07K-$2.21K support cluster, a range that encompasses both the critical daily support zone and the 0.5 Fibonacci retracement level. Watch for whether the pullback finds buyers above $2.21K or extends deeper into the confluence zone; a decisive break below $2.07K would signal that the broader bullish structure requires re-evaluation, whereas a reaction from this area would confirm the breakout remains intact and positioning for another assault on $2.44K-$2.55K resistance is warranted.
Original reporting: cryptopotato.com