Ethereum Price Analysis: ETH Clears $1.9K, but a Bigger Test Awaits
Ethereum has recovered to $1.92K following a sharp June selloff, but institutional traders face a critical near-term inflection: the asset must clear $2.1K to break a bearish daily structure, while on-chain data shows accumulation patterns that could support further upside if technical resistance yields.
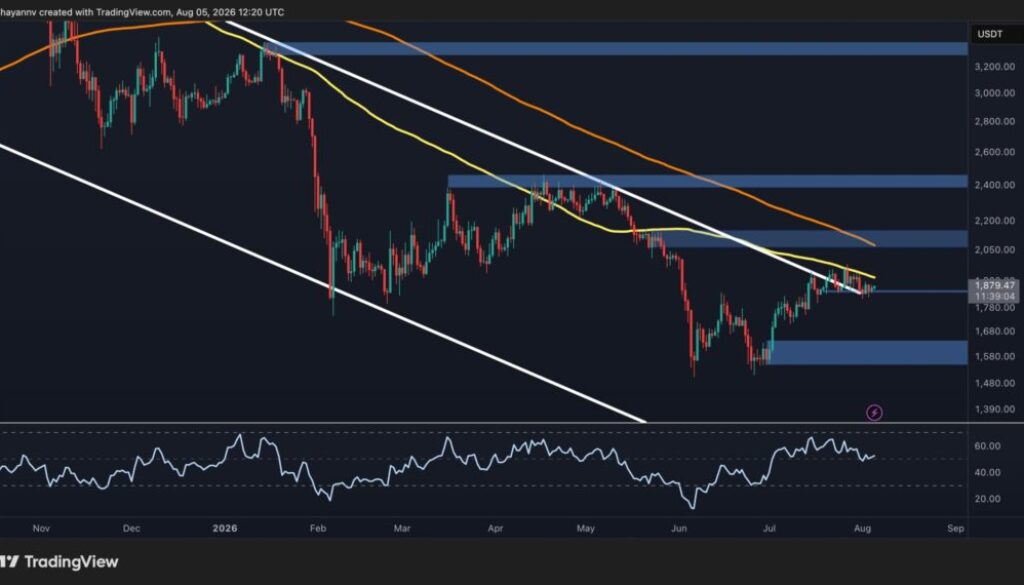
- ETH recovered to $1.92K after bouncing from the $1.6K demand zone, breaking above the long-term descending trendline and 100-day moving average near $1.9K
- Exchange supply ratio fell to approximately 0.127, the lowest cycle reading, indicating concentrated off-exchange holding and reduced selling pressure
- Daily chart remains bearish below the 200-day moving average at $2.1K; a breakout above this zone targets $2.4K, while failure to hold $1.85K risks a retest of $1.6K lows
- $1.92K Current Ethereum price following recovery from June lows
- 0.127 Exchange supply ratio at cycle low versus prior elevated readings
- $2.1K 200-day moving average resistance blocking sustained bullish structure
Ethereum has reclaimed ground lost in a June liquidation cascade, with price now trading at $1.92K after aggressive buyer absorption at the $1.6K demand zone. The recovery has been steep enough to recross the 100-day moving average and pierce a multi-week descending trendline that had capped rallies since late July, signaling a tactical shift in short-term momentum.
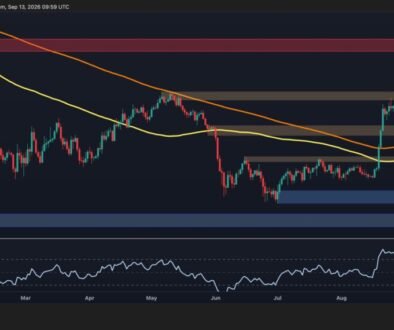
However, the asset remains trapped beneath the 200-day moving average, which continues to slope lower from $2.1K, and this level has become the critical gatekeeper for any sustained bull narrative.
For institutional investors accustomed to trading with moving-average confluence and macro regime signals, Ethereum’s current chart structure presents a textbook lower-timeframe reversal attempt constrained by higher-timeframe bearish setup. The bounce has sufficient on-chain backing to warrant attention, but daily-chart sellers have not yet capitulated.
Descending Trendline Breach Opens Short-Term Wedge Setup
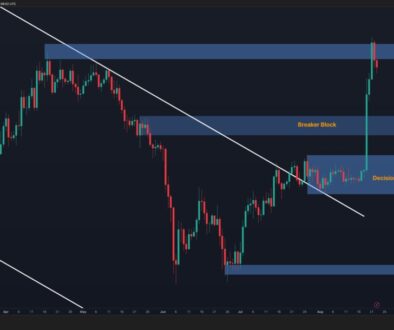
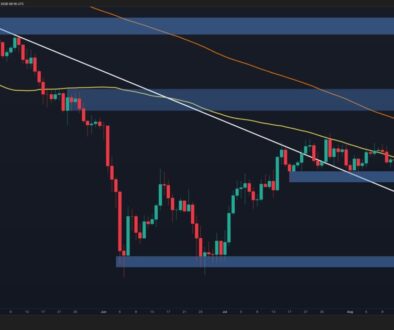
The 4-hour timeframe reveals a more constructive near-term pattern that institutional technical analysts will recognize: a falling wedge formation with strong bid support around $1.85K. Over recent sessions, Ethereum has compressed price action into a narrowing range beneath a descending trendline that capped the post-July rally, while buyers have repeatedly defended higher lows.
This setup mirrors a classic pre-breakout consolidation, and a decisive close above the trendline on the 4-hour chart would target the psychological $2K level and the upper boundary of a longer-term ascending channel.
The wedge structure gains credibility because support has held despite persistent selling pressure. Each test of $1.85K has been met with renewed buying interest, compressing volatility and raising the probability of a directional break.
On the upside, clearing the wedge and $2K would expose the daily resistance cluster at $2.2K to $2.4K, a zone that previously functioned as a major distribution area and would represent a 15-17% gain from current levels.
Conversely, the setup remains fragile. A failure to break the trendline and a drop below $1.85K would invalidate the short-term bounce entirely, likely reopening the path to the $1.75K zone and challenging the broader $1.6K demand level that initiated the recovery.
For traders with tight risk management, this dichotomy creates a binary trade: either buyers establish fresh structure above $2K, or the bounce is merely a retest of support en route to lower prices.
Exchange Outflows Signal Accumulation Phase Rather Than Distribution
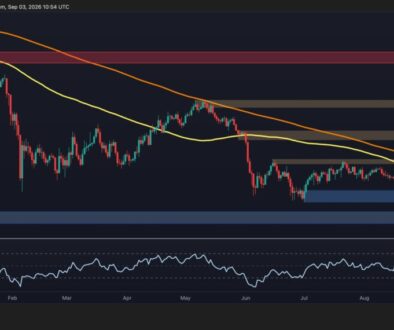
On-chain metrics provide the constructive underpinning that technical traders often ignore at their peril. The Exchange Supply Ratio, a key measure of how much Ethereum circulating supply is held on centralized exchanges, has fallen to approximately 0.127, marking the lowest point visible on the tracking chart.
This metric matters because sustained declines in exchange balances historically precede sustained rallies: coins moving off exchanges into self-custody or long-term holder wallets suggest reduced immediate selling pressure and a shift from distribution to accumulation behavior.
The decline is not marginal noise; it represents a structural shift in holder positioning over weeks of downward pressure. During capitulation events, retail and weak-handed holders typically panic-sell into exchanges to exit positions. The opposite dynamic, fewer coins on exchanges at lower prices, points to confident buyers absorbing supply.
For institutions evaluating where the smart money is positioned, this off-exchange accumulation is a yellow flag for those betting on a sustained breakdown below $1.6K.
However, falling exchange balances alone do not guarantee a rally. The metric confirms that the bid is present and that holders are consolidating positions, but it does not guarantee a specific price target or timeline. ETH could trade sideways for weeks while exchange ratios remain low, or the accumulation could fail to translate into price support if macro headwinds intensify.
The on-chain setup creates favorable conditions for a bounce; the technical chart setup determines whether that bounce has legs.
$2.1K Convergence Zone Will Define Bull vs. Bear Medium-Term Outlook
The critical near-term battleground lies at $2.1K, where the 200-day moving average converges with a major historical supply zone. This is not a single line to watch; it is a cluster of resistance formed by both dynamic moving-average pressure and prior distribution price levels.
For institutional traders, this convergence is textbook: when multiple technical factors align at a single price level, the zone gains structural importance and often marks a pivot point for the broader trend.
A successful breakout and daily close above $2.1K would accomplish three things simultaneously: it would place price above the 200-day moving average for the first time in months, invalidate the longer-term bearish structure beneath that moving average, and target the next resistance cluster near $2.4K. In bull-market terms, reclaiming the 200-day MA is often the first signal that the trend has turned decisively higher.
Given the on-chain accumulation backdrop and the 4-hour wedge setup, a breakout above $2.1K would create a multi-timeframe bullish alignment that could attract institutional rebalancing and trend-following capital.
Failure to clear $2.1K and a reversal back below $1.85K would have the opposite implication: the bounce was a relief rally within a broader downtrend, and sellers retain structural control. In that scenario, the path back to $1.6K and potentially lower would reopen, forcing defensive traders to reassess their medium-term outlook.
The medium-term narrative is entirely dependent on whether this convergence zone holds or breaks in the coming days to weeks.
Ethereum’s next major move will likely be triggered by a close above or below the $1.9K to $2.1K band on the daily timeframe; watch for a decisive breakout on the 4-hour chart above the descending trendline as the early signal that buyers have the structural edge, with the $2K psychological level and the upper ascending-channel boundary serving as intermediate targets before the critical $2.1K, $2.4K resistance cluster comes into play.