
Bitcoin Dips Below $60K in Extreme Fear — Read This Before You Do Anything
Bitcoin Dips Below $60K in Extreme Fear — Read This Before You Do Anything
Bitcoin just broke below $60,000. The Fear & Greed Index is sitting at 12 — Extreme Fear. One week ago it was near 52. That is a full swing from Greed to Extreme Fear in seven days.
I’ve been watching this market long enough to know what this kind of move feels like from the inside. It doesn’t feel like an opportunity. It feels like the bottom might fall out. That’s exactly why it’s worth paying close attention right now.
Let’s look at what the data actually says. The daily RSI is at 17, among the most oversold readings in years. Bitcoin is trading well below the 20-day, 50-day, and 200-day moving averages. That’s a structural breakdown, not a routine pullback. It doesn’t automatically mean we bounce. But it does mean the selling pressure is historically extreme.
What hasn’t changed: the GENIUS Act is law. Institutional capital is still moving on-chain. Stablecoin infrastructure is scaling. Neil Steinhardt at Nexo told me just a few weeks ago that the amount of institutions willing to work in this space increased considerably after the GENIUS Act passed — and that was before this dip.
Historically, the moments that feel like this — $60K with a Fear & Greed of 12 — are rarely the right time to panic out. They’re the moments that look obvious in hindsight. That said, no one rings a bell at the bottom. If you’re holding through this: know why you’re holding. If you’re watching from the sidelines: know what level brings you back in.
$60K is the line right now. How Bitcoin behaves around it over the next few sessions will set the tone for the weeks ahead.
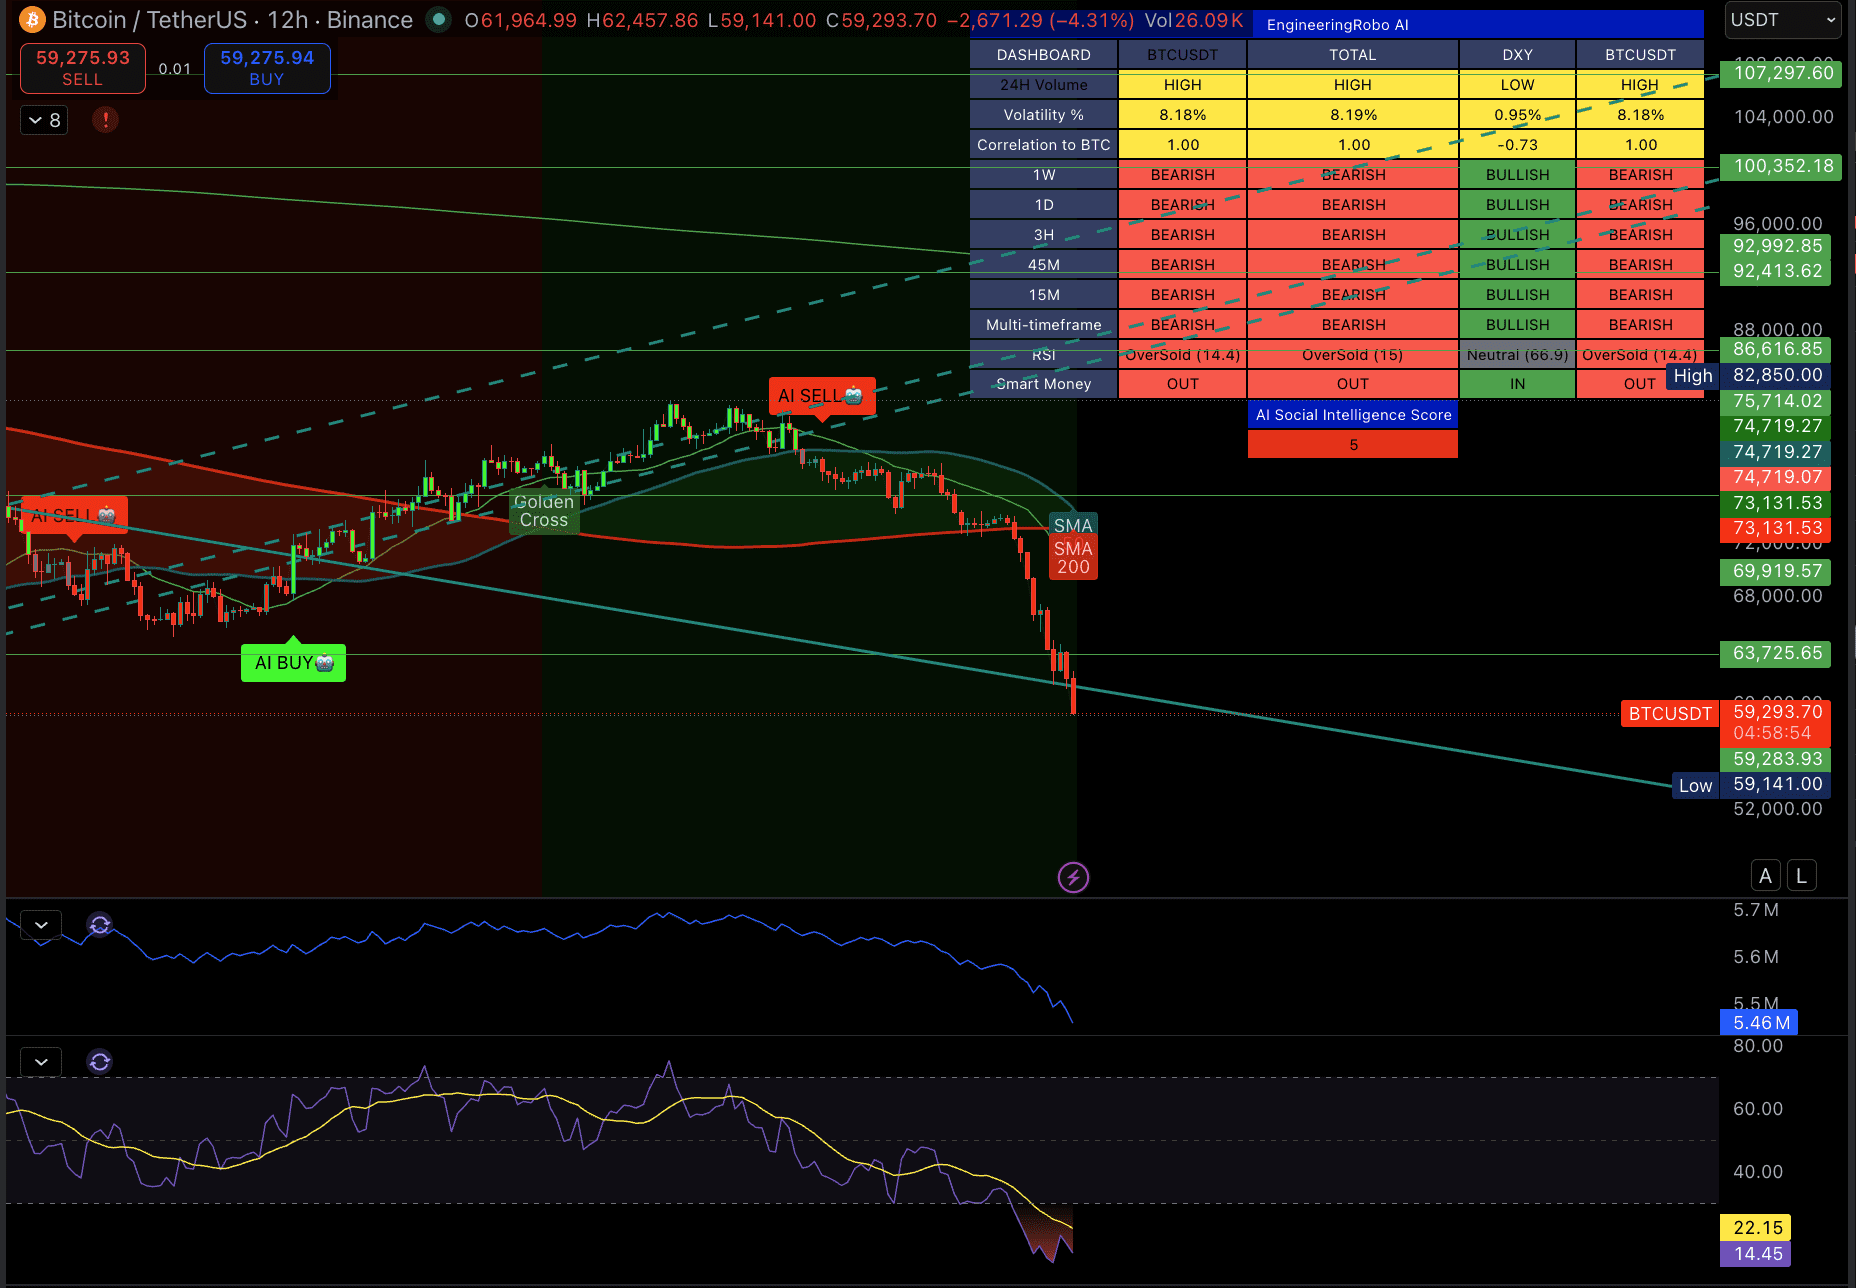
Bitcoin is trading at $59,293 on the 12-hour chart and the picture is about as clean as it gets — cleanly bearish across every timeframe. The 1W, 1D, 3H, 45M, and 15M are all red on EngineeringRobo. Multi-timeframe consensus: BEARISH. Smart Money is OUT. The RSI is sitting at 14.4 — one of the most oversold readings this cycle. Price knifed through both the SMA 50 and SMA 200 in a single move, with volume dropping on the way down, which tells you this is not panic selling finding a floor yet — it is a controlled bleed with sellers still in control.
The Death Cross is confirmed on the chart. The Golden Cross that gave bulls hope earlier in the cycle has been fully reversed. There is no timeframe on this chart showing buyers have any edge right now. The AI Social Intelligence Score is 5 out of 100, meaning sentiment from social channels is as negative as it gets.
Do not try to catch this falling knife without a confirmed close above structure. Manage your risk accordingly.
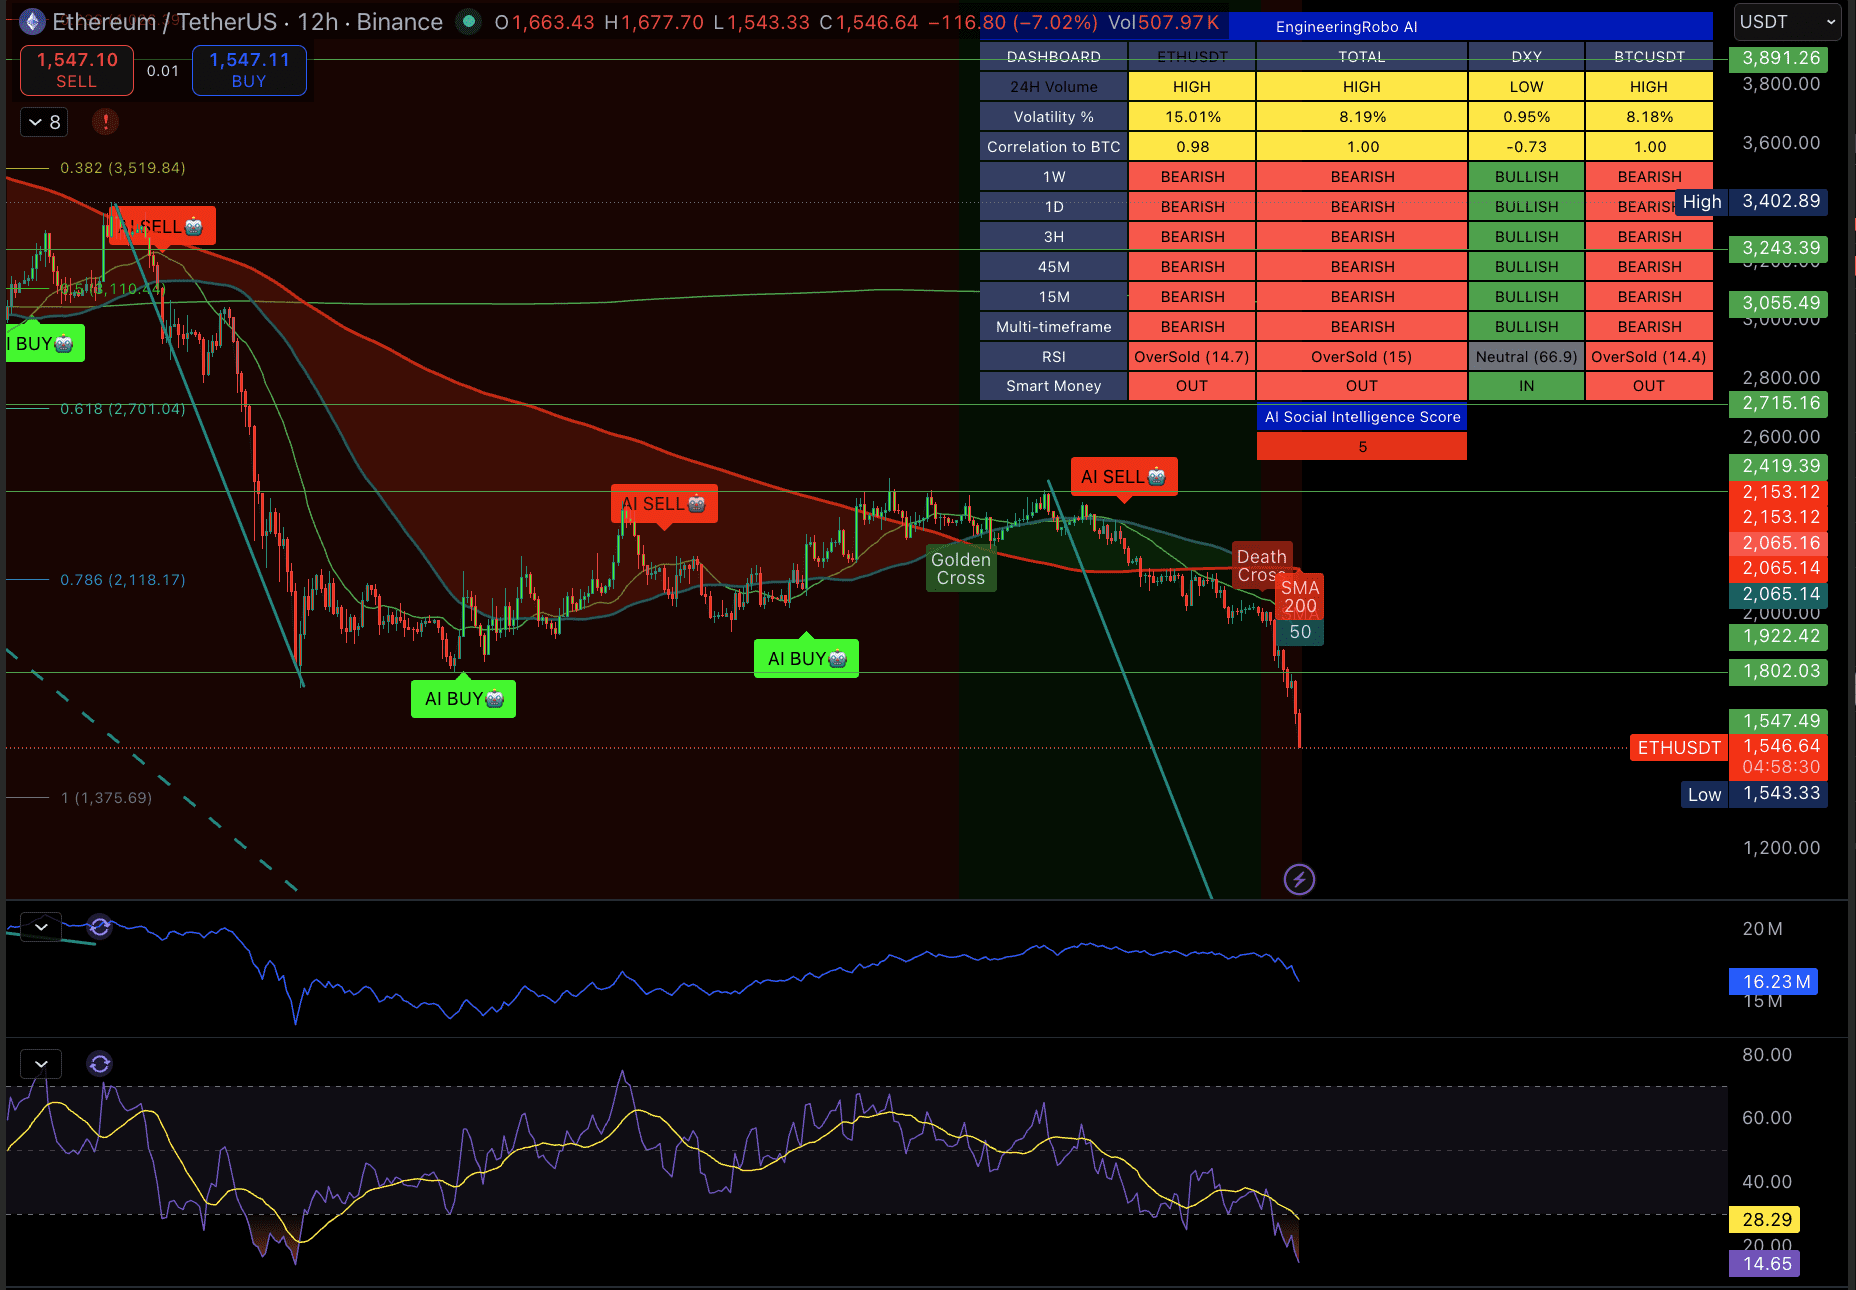
Ethereum is at $1,546 and it is not just following Bitcoin down — it is leading it lower. ETH is showing 15.01% volatility versus BTC’s 8.18%, and with a 0.98 correlation to Bitcoin, it is absorbing almost the full force of this move with added leverage to the downside. ETH is down 45% year to date versus BTC’s 32%. When the market sells off, ETH sells harder. That pattern is holding.
The Death Cross formed and has accelerated. Price is well below both the SMA 50 and SMA 200. All timeframes from 1W down to 15M are BEARISH on EngineeringRobo. RSI is at 14.7 — slightly more oversold than Bitcoin. Smart Money is OUT. The AI Social Intelligence Score is 5 out of 100. There is no timeframe or signal on this chart showing accumulation.
The Fibonacci structure is worth watching. The 0.786 level at $2,118 was the last meaningful support that gave way. Price is now in open air between that level and the 1.0 extension at $1,375. The session low is $1,543, which is sitting almost exactly on that 1.0 level. That is the line.