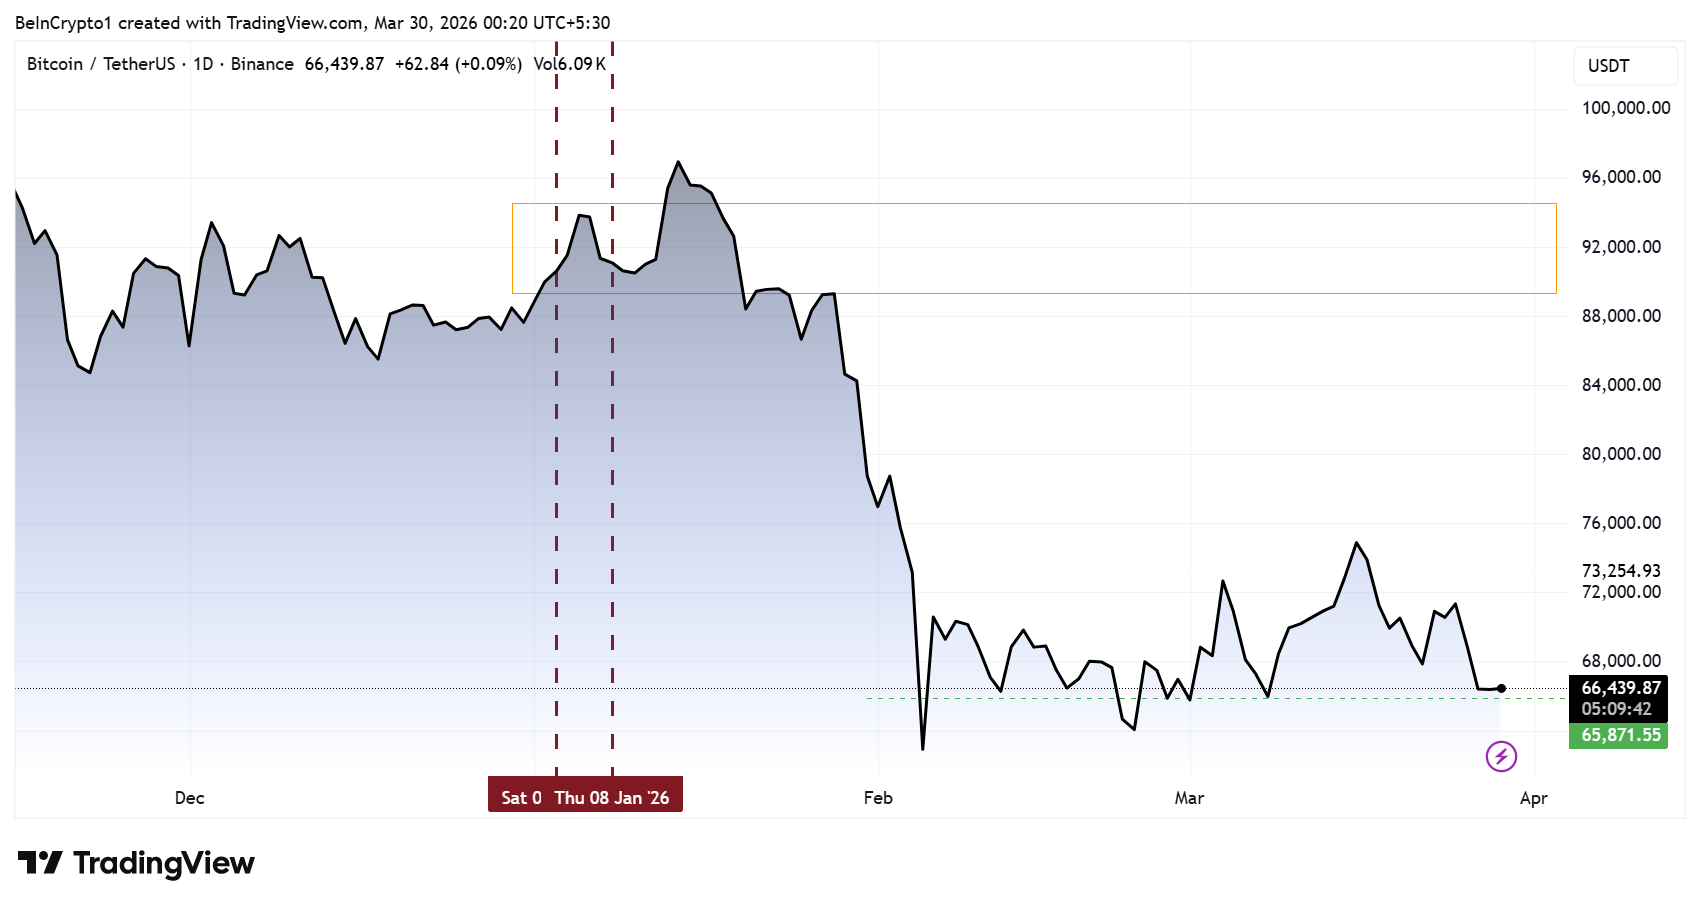
Bitcoin is stuck at a critical juncture, trading within a compressed range that has defined price action for weeks. The cryptocurrency sits near $70,400, caught between powerful resistance overhead and support that has held firm multiple times. Traders and analysts are increasingly focused on whether Bitcoin will break decisively higher or slip into another significant decline—a question that hinges entirely on how the asset behaves at several key technical levels in the coming days.
Market Context and Industry Significance
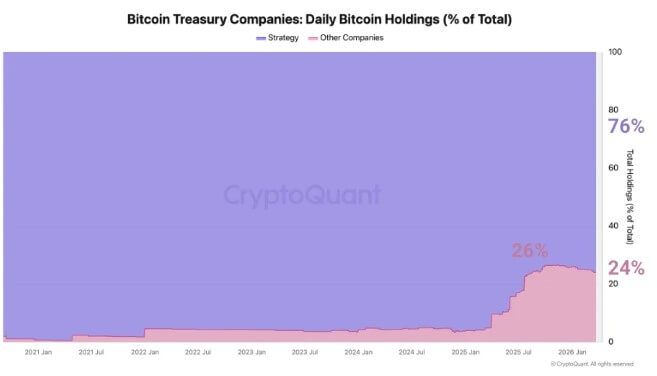
Bitcoin’s current consolidation arrives at a pivotal moment for the broader digital asset ecosystem. The cryptocurrency market has matured significantly over the past decade, with institutional participation now representing a substantial portion of trading volume. Major financial institutions, including hedge funds, asset managers, and corporations, now hold Bitcoin as part of diversified portfolios, fundamentally changing how price discovery occurs compared to earlier market cycles.
This institutional involvement means that price movements at key technical levels carry heightened significance. When Bitcoin reaches resistance zones like $72,000–$76,000, the decision-making processes involve not just retail traders but sophisticated institutions managing billions in capital. These participants rely on both technical analysis and macroeconomic factors—including Federal Reserve policy, inflation data, and global economic conditions—to determine position sizing and entry/exit strategies.
The compressed trading range currently observed reflects genuine uncertainty about Bitcoin’s macro trajectory. While some analysts point to historical patterns suggesting Bitcoin should trade significantly higher, others emphasize the headwinds created by persistent inflation concerns and potential interest rate volatility. This divergence of opinion is precisely what creates the tight consolidation we’re witnessing.
The Resistance Ceiling That Keeps Rejecting Rallies
The $72,000 to $76,000 zone has emerged as an almost impenetrable barrier. Every time Bitcoin has attempted to rally into this band over recent weeks, selling pressure has materialized with consistency. This ceiling is not accidental—it represents a level where previous sellers and profit-takers have congregated, creating a natural bottleneck for upward momentum.
Breaking above this zone would be the first genuine signal that a more substantial rally is taking hold. Until that happens, the market remains in a holding pattern. Traders waiting for confirmation of a directional move are essentially watching this resistance level as the primary gatekeeper.
From an industry perspective, a sustained break above $76,000 would likely trigger accelerated buying from institutional players who have been waiting for technical confirmation. Many systematic trading strategies employ breakout algorithms that automatically increase position size once resistance is decisively cleared. This could create a multiplier effect, where initial buying pressure draws in additional participants, leading to more rapid price appreciation.
Every rally into the $72,000–$76,000 zone continues to be met by consistent selling pressure, keeping Bitcoin locked in place.
— Market Analysis, Technical Structure
Support Levels That Have Proven Their Worth
On the flip side, Bitcoin has found stability at lower levels. The macro trendline near $64,000 has held support on two separate occasions, preventing what could have been a more serious breakdown. This repeated floor represents the only meaningful technical structure currently preventing a broader bearish shift in momentum.
Below $64,000, attention turns to $62,433 and the $60,000 psychological level. A daily close beneath this band would represent a material breakdown and would likely expose even deeper support around $55,230 and $47,256. However, as long as Bitcoin respects these lower levels, the case for an eventual recovery remains intact.
The significance of the $60,000 level extends beyond pure technical analysis. Throughout 2024, $60,000 emerged as a critical price point in the minds of market participants—traders who missed initial rallies often identify this level as a re-entry opportunity. Consequently, substantial buy orders tend to cluster around this price, creating a natural barrier against further declines. Breaking below this level would signal that accumulation demand has been exhausted and that a new phase of distribution is underway.
Key Support Zone
The $60,000–$62,433 range acts as a critical threshold. A daily close below this level significantly increases bearish pressure and could trigger a move toward $55,230.
Pattern Recognition Points Toward Potential Recovery
Technical analysts have identified early signs of recovery structures forming on the 4-hour timeframe. A small inverse head and shoulders pattern is beginning to take shape, which could potentially activate a move toward the $75,000 level if confirmed. This would represent the lower bound of resistance but still a meaningful move from current prices.
More ambitiously, some traders are monitoring for a larger cup and handle formation that could develop if Bitcoin successfully tests $75,000 and then consolidates. A strong close above $75,000 would provide confirmation that this pattern is active and could signal continuation into higher territory.
The $79,354 level represents another critical inflection point on the 4-hour chart. A break above this price would mark the first higher high in recent trading sessions—a development that would strengthen conviction in an uptrend scenario and potentially open a path toward $98,200.
These pattern formations are not merely academic exercises in technical analysis. They represent consensus reference points that market participants use to organize their thinking about probable outcomes. When a cup and handle formation completes successfully, the statistical likelihood of continuation is well-documented across multiple asset classes. This historical track record gives traders confidence to add to positions, creating the self-fulfilling prophecy that makes such patterns effective.
Bullish Confirmation Level
A daily close above $98,200 would confirm a higher high on the daily chart and substantially strengthen the case for continued upside momentum across multiple timeframes.
The Caution Zone Where Bears Could Reassert Control
Not all higher levels are created equal. Bitcoin faces a potential bearish pattern setup in the $107,000 to $109,000 zone. This region warrants caution because a failure to break decisively above the previous highs in that band could trigger another downward phase.
Traders eyeing extended rallies must keep this area in mind. What might appear to be a successful breakout could run into resistance that redirects price action lower, creating a false breakout that catches aggressive buyers off guard.
This caution zone is particularly important because it represents the frontier of previous bull market territory. In Bitcoin’s history, failed attempts to exceed previous all-time highs have frequently resulted in sharp corrections. The psychological weight of these levels cannot be overstated—traders who experienced previous bull cycles remember where their profits turned to losses, and many maintain sell orders at these psychological barriers.
A move toward $98,200 is possible, but caution is warranted near $107,000–$109,000 where a potential bearish pattern could emerge if Bitcoin fails to clear previous highs decisively.
— Technical Analysis, Higher Timeframe Resistance
What Confidence Really Requires Right Now
The current market environment lacks conviction. The 200-period exponential moving average sits around $86,380, far enough away that it remains irrelevant to immediate price action. This suggests traders are not currently using longer-term moving averages as reliable guides—they’re instead watching the near-term range boundaries.
Genuine bullish confidence will only materialize when Bitcoin achieves a convincing close above $75,000. Until that happens, every rally into resistance can be viewed with skepticism, and every dip toward support can be questioned as to whether it will ultimately hold.
From a market structure perspective, this lack of confidence is actually healthy. Extended consolidations often precede the most powerful directional moves, as traders shake out weak hands and establish core positions. The longer Bitcoin remains in this range, the greater the potential energy building for the eventual breakout.
Industry Implications of Current Price Action
Bitcoin’s consolidation has important implications beyond simple price prediction. The cryptocurrency exchange sector, mining operations, and derivative platforms all calibrate their operations based on Bitcoin’s price trajectory. A sustained move higher would likely increase activity across these verticals, potentially increasing revenue for established platforms and attracting new institutional entrants to the space.
Conversely, a breakdown below support would trigger a period of contraction, with reduced trading volumes and potentially forced liquidations on leveraged positions. This creates genuine stakes for market participants beyond simple profit and loss—their businesses and livelihoods depend on Bitcoin’s directional moves.
The broader macroeconomic environment also deserves consideration. Bitcoin has demonstrated increasing correlation with technology stocks and risk assets generally. Should equity markets experience a significant correction, Bitcoin could be dragged lower regardless of its technical setup. Conversely, any significant deterioration in confidence in traditional assets could drive capital toward Bitcoin as a hedge, potentially accelerating any breakout above resistance.
The Path Forward
The market remains in a classic wait-and-see phase. Momentum has stalled. Volatility has compressed. All the conditions are set for a decisive move—the only question is which direction. Current price action suggests we are approaching that decision point sooner rather than later.
For traders and investors monitoring Bitcoin’s technical setup, the next few trading sessions will likely prove pivotal. A clear break above $76,000 with volume would signal a bullish scenario is developing. A breakdown below $64,000 would confirm bears have taken control. Everything between those levels remains contested territory.
Ultimately, Bitcoin’s next major move will determine sentiment across the entire cryptocurrency industry for months to come. The outcome of this compressed consolidation will influence capital allocation decisions, regulatory approaches, and investment strategies across the global financial system. In this respect, the technical levels being watched by traders represent far more than simple price targets—they represent inflection points in how the world’s first and most established cryptocurrency is perceived and valued.