
BTC Price Analysis: Bitcoin Rebounds From $76K but Crucial Resistance Remains Above $80K
Bitcoin’s rebound from $60K to $78.5K demonstrates technical resilience, but persistent resistance at $82K and rising whale exchange activity signal critical headwinds for institutional traders. For long-term accumulation strategies, the current price action represents a pivotal moment where confirmation of breakout dynamics will determine whether the recovery sustains or faces deeper correction.
Bitcoin has mounted a significant recovery from its $60K support zone, rallying to hold above $78.5K amid what appears to be a technically constructive structural improvement on daily timeframes. However, technical analysis reveals a market caught between competing forces: while price action has reclaimed critical moving average support and broken above intermediate resistance at $67K and $72K zones, institutional investors face a crucial inflection point at the $82K resistance level. Simultaneously, on-chain data presents a cautionary signal, with the exchange whale ratio rising significantly—a metric that historically correlates with potential selling pressure from large-holder liquidation patterns. This confluence of technical resistance and growing on-chain supply concerns has created an environment where conviction remains tempered despite the recovery narrative dominating recent market sentiment.
Daily Timeframe Signals Constructive but Unconfirmed Recovery Structure
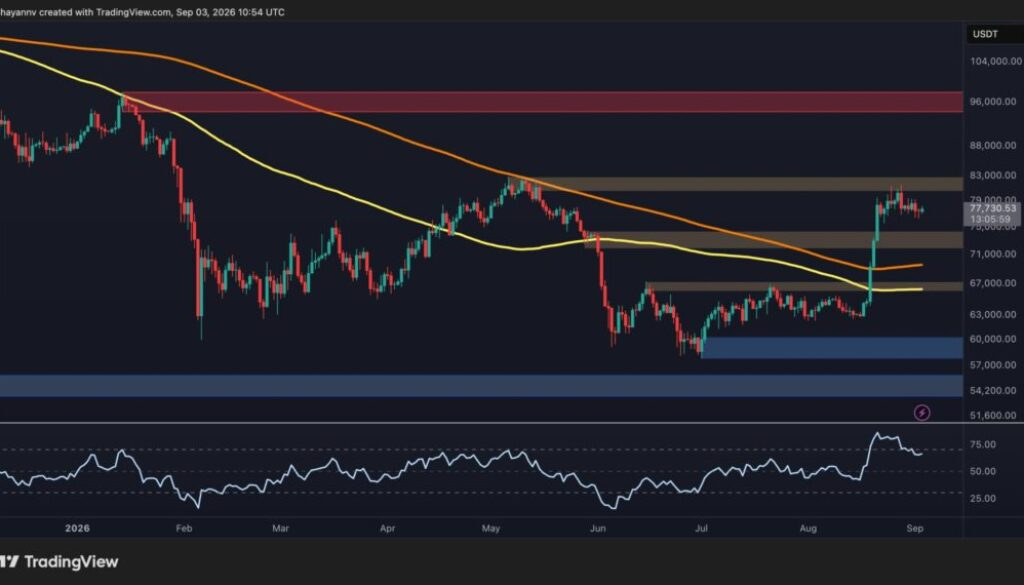
The daily chart reveals substantial technical improvement since the June bottom, with Bitcoin successfully reclaiming critical support zones that had previously acted as major resistance barriers. After establishing support at $60K, BTC broke decisively above $67K—a psychologically important level—before surging through the $72K zone, which had functioned as resistance during the preceding downtrend. The cryptocurrency now trades comfortably above both major moving averages, a structural position that institutional traders typically recognize as bullish. This recovery has restored what technical analysts term “higher lows,” a foundational element of bullish sequence development that suggests a potential shift from downtrend to uptrend structure.
The immediate technical challenge centers on the $82K resistance zone, which coincides with recent swing highs and represents far more than simple price resistance for institutional frameworks. A sustained daily close above $82K would mark a critical inflection point—essentially confirming that the recovery has evolved from a corrective bounce into a legitimate bullish continuation pattern. Such confirmation would theoretically clear the technical path toward the $95.6K resistance region, representing approximately 15% upside from current levels. Conversely, rejection at $82K would signal that selling pressure remains sufficiently strong to cap advances, potentially indicating that institutional accumulation has not yet reached decisive momentum.
Momentum indicators present a nuanced picture that warrants careful interpretation. The daily Relative Strength Index (RSI) has recovered substantially from oversold territory that characterized the June capitulation, currently trading just below overbought thresholds. However, this momentum metric has begun to roll over from elevated levels, suggesting that buying momentum is cooling rather than accelerating—a divergence that often precedes minor pullbacks or consolidation periods. On the downside, the $72K zone now functions as critical support; maintaining this level would preserve the broader recovery structure, while a breakdown below it could rapidly deteriorate sentiment and trigger a retest of the $67K region. The daily structure thus remains “cautiously constructive,” in technical vernacular, but clarity on the $82K breakout remains essential for longer-term position sizing confidence.
Four-Hour Timeframe Reveals Tighter Consolidation and Elevated Caution
While the daily chart presents a constructive recovery narrative, the four-hour timeframe reveals a more constrained technical picture that suggests institutional traders should maintain elevated caution. Since late August, when Bitcoin reached the $82K area, price action has been consolidating within a falling wedge-like structure—a pattern characterized by converging upper and lower trendlines that typically precedes a directional breakout. The upper trendline of this wedge has repeatedly capped successive advances, acting as a persistent ceiling that has repelled multiple buying attempts. The lower boundary of this consolidation currently sits near $76K, establishing the parameter of this intermediate trading range.
Bitcoin is currently testing the upper boundary of this wedge structure around the $78K mark, positioning the cryptocurrency at an inflection point on intraday timeframes. A successful breakout above this resistance line—which slopes downward as time progresses—would represent the first meaningful indication that buyers are attempting to reassert short-term control and potentially establish momentum toward the $82K daily resistance level. However, failure to break the wedge coupled with a move below $76K would trigger a cascade toward the $72K-$74K support zone, which has transitioned from resistance to support following its earlier breakout. This support zone carries particular significance because a breakdown below it would not only undo the recent recovery’s positive price action but would also signal potential deeper structural deterioration on daily timeframes. For institutional traders managing medium-term positions, holding the $72K-$74K zone represents the critical condition for preserving the recovery thesis.
The technical structure across multiple timeframes suggests a market requiring greater conviction before committing significant institutional capital to new long positions. The daily chart presents constructive elements, but the four-hour consolidation indicates that short-term sellers remain present and capable of capping advances. This dynamic creates an environment where traders should focus on confirmation patterns—specifically, a clean breakout above the four-hour wedge resistance coupled with a daily close above $82K—before recognizing this as a sustained bullish continuation rather than another temporary relief rally.
On-Chain Whale Activity Introduces Supply-Side Headwinds
Perhaps the most concerning signal for institutional investors comes from on-chain metrics, particularly the rising exchange whale ratio. This measure quantifies the proportion of exchange inflows attributable to the largest holders—those classified as “whales” in crypto market terminology. A significant increase in this ratio historically correlates with potential selling pressure, as whale accumulations on exchanges typically precede distribution or liquidation activity. In the current market context, this metric represents a potentially bearish supply-side signal that runs counter to the otherwise constructive technical structure visible on price charts. For institutional traders operating with sophisticated risk management frameworks, this divergence—improving technicals coupled with deteriorating on-chain supply metrics—demands heightened vigilance regarding position sizing and risk exposure.
The whale ratio signal carries particular weight for long-duration institutional positions because it reflects actual holder behavior rather than speculative sentiment. Unlike sentiment indicators or social media metrics, exchange whale activity represents concrete movement of significant capital that precedes actual market impact. When major holders begin accumulating Bitcoin on exchanges—the infrastructure necessary for liquidation—it suggests that even entities with long-term conviction are preparing optionality for potential exits or rebalancing. This on-chain development introduces a scenario where price weakness could accelerate rapidly if these whale positions begin executing distributions while technical resistance remains intact at $82K.
The confluence of elevated whale exchange inflows with technical resistance at $82K creates an asymmetric risk profile that institutional investors should acknowledge explicitly. While the technical recovery structure offers upside potential toward $95.6K, the on-chain deterioration suggests that reaching such targets may prove more difficult and volatile than simple price chart analysis would indicate. Portfolio managers should consider this dynamic as a constraint on aggressive accumulation until either the whale ratio stabilizes at lower levels or price action confirms that on-chain supply concerns are being absorbed by buyers rather than creating selling pressure.
Institutional Framework: Breakout Confirmation Requirements for New Positions
For institutional investors evaluating position entry or expansion strategies, the current market environment demands explicit breakout confirmation before committing meaningful new capital. The technical setup requires Bitcoin to decisively clear both the four-hour wedge resistance near $78K and, more importantly, the daily resistance at $82K, ideally through daily closes above these levels. A price action that simply touches these zones without establishing follow-through buying momentum should not be interpreted as sufficient confirmation for new institutional accumulation. The on-chain whale ratio signal suggests that caution is warranted, and that structural confirmation across multiple timeframes would provide greater conviction than a single bullish price move.
The $72K-$74K support zone remains the critical condition for maintaining constructive intermediate-term structure. A breakdown below this area would suggest that the recovery has failed and that deeper corrections toward $60K or lower cannot be ruled out. Conversely, if price action remains supported at this zone while building a base for another advance, institutional frameworks should prepare for potential breakout attempts toward $82K and beyond. The coming days and weeks will likely provide clarity on which scenario is developing, allowing institutional traders to calibrate position sizing and risk management accordingly. Until explicit breakout confirmation emerges, prudent risk management suggests maintaining defensive positioning while monitoring for higher-conviction entry signals.
Bitcoin’s current price structure represents a critical decision point for institutional portfolios. The technical recovery framework provides constructive elements, but elevated ca