The leading stablecoin issuer has released its attestation report for the first quarter of 2026, revealing a net profit of more than $1 billion. The company was able to generate such profit despite broader volatility and unstable market conditions. This development comes as stablecoins evolve into major dollar infrastructure globally, especially in markets with limited access to USD banking systems.
According to a press release, the leading independent accounting firm, BDO, prepared the attestation, confirming the accuracy of Tether’s financial figures and reserves report.
Tether Releases Q1 2026 Attestation Report
While generating a net profit above $1.04 billion, Tether’s excess reserve buffer hit a record $8.23 billion. The reserve base is concentrated in short-duration, high-quality liquid instruments. By March 31, the firm’s direct and indirect exposure to U.S. Treasury bills had reached $141 billion, making Tether the 17th-largest holder of U.S. Treasuries globally. Tether says short-dated sovereign exposure remains central to its reserve strategy.
In addition to the Treasury bills, Tether’s reserves include precious metals, consisting entirely of $20 billion in physical gold and $7 billion in bitcoin. The goal is to maintain a balance between liquidity, resilience, and exposure to macro assets that perform under stressful conditions.
“Our responsibility is to make sure USD₮ works without compromise. That means building a system that behaves the same way in any market condition, not just when things are stable. The focus is on keeping the structure simple, liquid, and resilient by design, so it does not depend on favorable environments or external support,” Tether’s CEO, Paolo Ardoino, said.
USDT Grows by $5B
Overall, Tether had over $191.7 billion in assets and $183.5 billion in liabilities as of March 31, 2026. The entity’s assets exceed its liabilities by more than $8.2 billion.
Noteworthily, Tether’s proprietary investments are not included in its USDT reserves. They are fully segregated and funded from the firm’s excess capital and profits. The company claims the investments do not affect the quality, liquidity, or transparency of USDT reserves.
USDT in circulation has grown significantly, expanding by $5 billion in the second quarter of the year. The stablecoin’s market cap hovered above $189 billion at the time of writing.
“People should not have to question whether the system works; it just has to work,” Ardoino added.
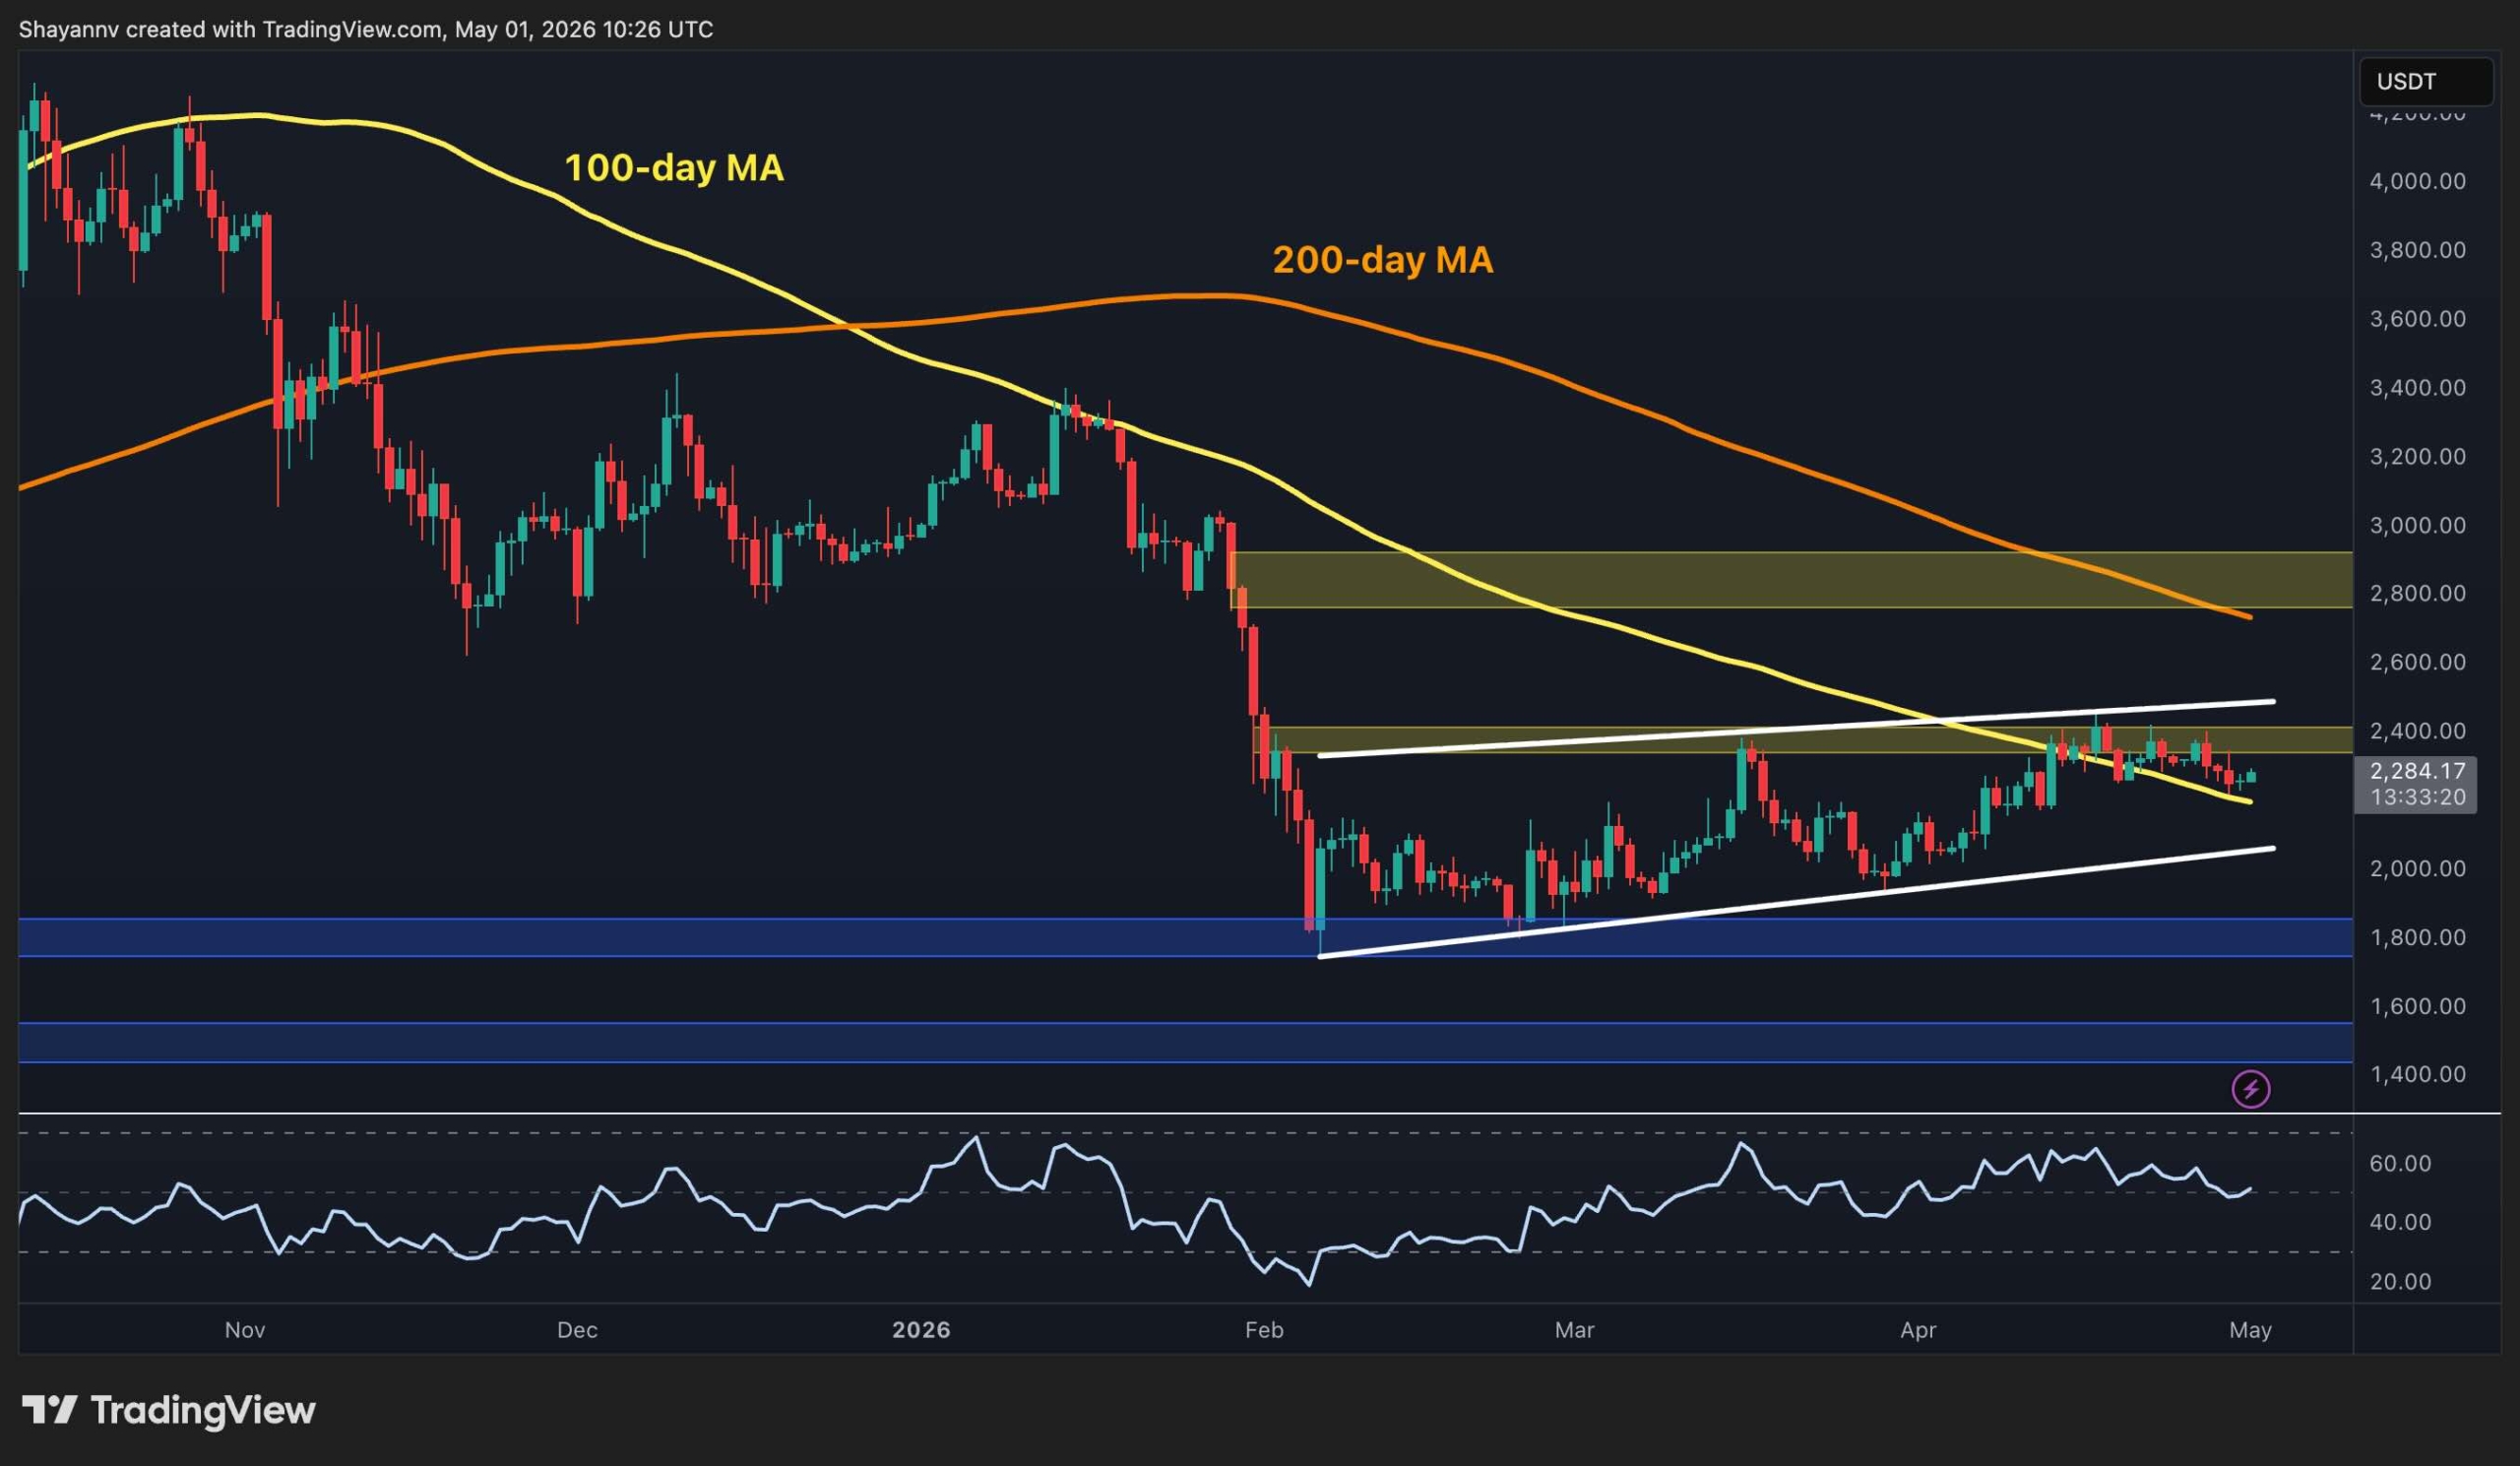
Bitcoin is trading at $78.3k as the first weekend of May opens. It has done something it has not managed since the cycle peak, which is closing above the 100-day MA and breaking out of a long-term descending channel that contained the entire bearish trend.
The move comes alongside strong daily RSI readings, a successful retest of the breakout level on the 4-hour chart, and an on-chain supply picture that explains precisely why the road ahead gets harder from here, and why it may be worth it anyway.
Bitcoin Price Analysis: The Daily Chart
On the daily chart, BTC has been pushing toward the higher boundary of the mid-term ascending channel after reclaiming the 100-day moving average, which has descended to the $72k zone. The RSI is climbing toward 70, showing consistent bullish readings while still leaving room for follow-through, as an overbought state has not been reached yet.
The immediate test remains the $80k supply zone, which has capped the price on every approach since February. A clean daily close above this area would open the path toward the $90k level, with the 200-day moving average also in the way near the $85k mark. On the downside, the lower boundary of the current zone at $75k is now the first line of support to defend, followed by the 100-day moving average located just below this level.
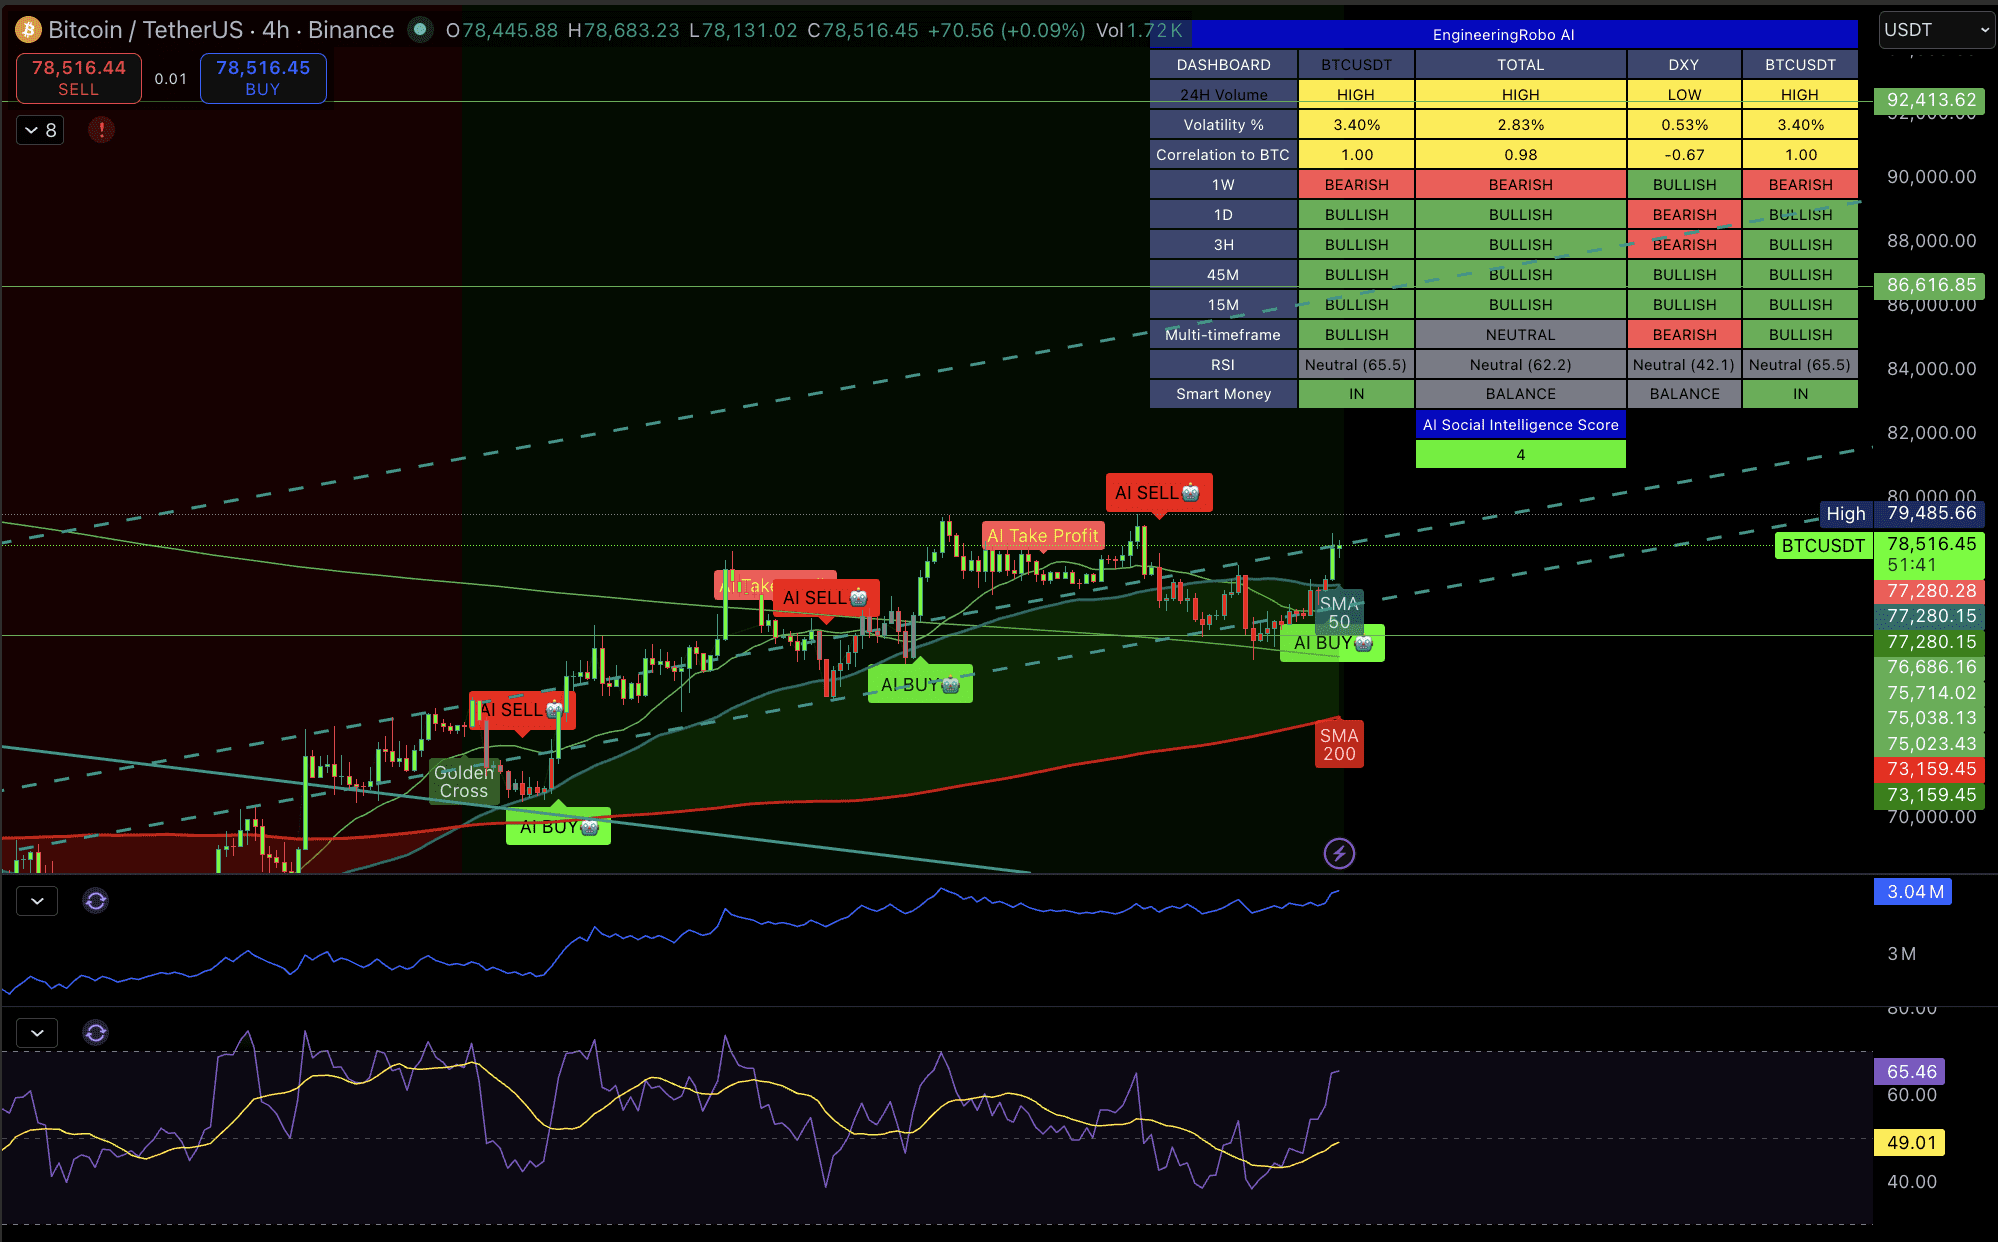
BTC/USDT 4-Hour Chart
The 4-hour chart shows a textbook post-breakout structure. The asset broke above the $75k level, pulled back to retest it, which is labeled explicitly on the chart, and has since pushed back toward the $79k region with the RSI also climbing above 60, showing a clear bullish shift in momentum. The structure is clean, and the retest adds conviction to the move.
The upper channel boundary and the $80k psychological level are converging as the immediate ceiling. A 4-hour close above the recent highs near $79.5k, with the RSI also holding below the overbought region, keeps the bullish structure intact and targets the $82k-$84k supply zone above. In case of any pullback, the $75k area can prove critical again, as it’s the major nearby support level on this timeframe.
On-Chain Analysis
With 64.2% of Bitcoin’s circulating supply currently in profit, the recovery from the February low has made meaningful progress, but the remaining 35.8% underwater tells the more important story. The bulk of that loss-making supply was acquired between $80k and $125k during the late 2025 distribution phase, meaning BTC is now entering the price range where a large cohort of holders approaches breakeven, and the incentive to sell intensifies.
Historically, crossing the 75–80% supply-in-profit threshold has marked the point where correction-driven overhead pressure meaningfully subsides, and momentum can sustain. The current reading of 64.2% confirms that the threshold has not yet been reached, which explains why the $80k–$90k zone has acted as such a stubborn ceiling.
Each push higher converts more underwater holders into profit-takers, but it also reduces the pool of forced sellers, and if the price can clear $80k, the supply-in-profit curve could accelerate rapidly toward levels that have historically preceded the next significant leg higher.
Last year was a significant one for real-world assets (RWAs), as the sector saw intensified competition, regulatory progress, and an influx of traditional institutional players. In fact, the RWAs sector performed so well that it outpaced stablecoins in growth.
According to CoinGecko’s RWA Report 2026, RWAs grew from 2.7% the size of stablecoins to 6.4% as the pace of tokenization accelerated in 2025. The report examines the sector’s growth from January 2025 through the end of Q1 2026.
RWAs Outpace Stablecoins in Yearly Growth
Within the last 15 months ending March 2026, the market cap of tokenized RWAs more than tripled from $5.42 billion to $19.32 billion. This represented a 256.7% growth from January 2025.
The RWAs sector comprises four asset classes: treasuries, commodities, stocks, and exchange-traded funds (ETFs). Tokenized treasuries have remained the largest asset class, adding $9 billion in market cap from January 2025. This accounted for a 225.5% increase during the reporting period. CoinGecko noted that momentum for this asset class surged after its market cap exceeded the $10 billion mark for the first time on February 11, 2026.
Despite the growth, the market share of tokenized treasuries fell slightly from 73.7% to 67.2% because other asset classes recorded notable growth. Commodities accounted for 28.7%, while stocks and ETFs captured 2.5% and 1.5%, respectively, by the end of Q1 2026.
The growth in tokenized commodity market share was driven by gold-backed tokens — Tether Gold (XAUT) and PAX Gold (PAXG). The market cap grew 289% from $1.43 billion to $5.55 billion within the report period. XAUT and PAXG accounted for 89% of the market cap growth. Notably, spot trading for tokenized gold surpassed the $84.6 billion traded in 2025 to reach $90.7 billion in Q1 2026.
RWAs Perpetuals Gain Traction
Furthermore, the market cap of tokenized stocks grew from $2.09 million in June 2025 to $486.69 million in March 2026. Tech companies like Circle, Tesla, Nvidia, and Alphabet led the charge. Spot trading volumes for this asset class totaled $15.1 billion by the end of last quarter, surpassing the $14.8 billion traded in the second half of 2025.
As for tokenized ETFs, this asset class recorded broad-based growth, with a market cap that rose from $0.62 million in July 2025 to $297.5 million by March 2026. It currently accounts for half the size of tokenized stocks.
Interestingly, the RWAs perpetuals volume grew from $313 billion for the whole of 2025 to $524.8 billion by Q1 2026. With this level of growth, 2026 is likely to see double the volume recorded for 2025.
A court in Hangzhou ruled that AI adoption is not an excuse for contract termination under China’s labor law after a tech company replaced a quality assurance supervisor with AI and dismissed him.
The Hangzhou Intermediate People’s Court agreed with the ruling of a lower court, stating that the firing of the employee, identified only by his surname Zhou, was unlawful.
AI won’t be taking jobs in China
A Chinese court has ruled that companies cannot fire employees just to replace them with artificial intelligence (AI). The Hangzhou Intermediate People’s Court upheld the ruling of a lower court, stating that a tech company illegally dismissed a worker after AI took over his job.
The worker, identified only by his surname Zhou, joined the tech company in November 2022, where he worked as a quality assurance supervisor checking the accuracy of AI outputs and earning a monthly salary of 25,000 yuan (approximately $3,640).
When large language models (LLMs) automated his tasks, the company offered him a lower position with a 40% pay cut to 15,000 yuan (about $2,185) per month.
Zhou refused the demotion and was fired as a result. The company offered 311,695 yuan (approximately $45,405) in severance and said the firing was due to organizational restructuring. The employee challenged through arbitration and won in two separate courts.
The main issue was deciding whether or not replacing employees with AI qualifies as a “major change in objective circumstances” under China’s Labor Contract Law. It is a standard that typically applies to events like company relocations or mergers, not choosing to adopt AI technology, the court found.
A similar case involving a map data collector who was replaced by AI and dismissed was published last year December by the Beijing Municipal Bureau of Human Resources and Social Security. The company’s decision to adopt AI was ruled to be a voluntary business choice, not an uncontrollable event, and so the employee’s contract was illegally terminated.
What are China’s AI ambitions?
Despite these rulings, Beijing has continued to push its industries to adopt AI at scale. Official data shows that China’s core AI industry exceeded 1.2 trillion yuan in 2025 and includes more than 6,200 enterprises. Next-generation AI terminals and agents are projected to reach a penetration rate above 90% by 2030.
The country’s generative AI adoption rate reached 42.8% in December last year, a significant increase of 25.2 percentage points year-on-year, expected to exceed 50% in 2026. Also, by the end of 2026, “AI+” applications are projected to reach 30% to 35% penetration across scientific research, manufacturing, finance, healthcare, governance, and global cooperation industries
China’s government aims to create over 12 million new urban jobs in 2026 in response to AI adoption. Notably, 12.7 million university graduates are expected to enter the job market this year.
Authorities intend to introduce more than 10 million subsidized training opportunities in 2026 to help workers transition into new roles. 72 new occupations, of which more than 20 are directly related to AI, were identified over the course of five years by the Ministry of Human Resources and Social Security.
Don’t just read crypto news. Understand it. Subscribe to our newsletter. It’s free.
They Said Nobody Was Coming to Bitcoin 2026. 35,000 People Disagreed. | Crypto Coin ShowCrypto Coin Show
Weekly Roundup · May 1, 2026
They Said Nobody Was Coming to Bitcoin 2026. 35,000 People Disagreed.
Saylor sold out. Afroman packed the floor. The FUD merchants were wrong. Bitcoin is up 13% in April and heading back toward $80K.
By Ashton Addison●CEO, Crypto Coin Show●Issue — May 2026●Read on Substack ↗
💬 Ashton’s Take
April was a good month for crypto. Bitcoin finished the month up roughly 13%, recovering from the lows and closing out April with real momentum despite the macro headwinds. Rising oil prices, the Iran blockade, and a Federal Reserve that held rates steady while signaling higher for longer. Crypto held its own against all of it. That’s worth saying out loud.
Before the conference started, the FUD was loud. People were saying nobody was coming. Bear market, wrong year, wrong energy. They were wrong.
Bitcoin 2026 drew somewhere between 30,000 and 40,000 people, right in line with last year when JD Vance headlined and the price was considerably higher. Michael Saylor returned and gave a standing-room only talk. Jack Mallers delivered one of the best keynotes of the conference. Mark Moss was on point. Eric Trump’s panel drew a massive crowd. And Afroman’s performance pulled just as many people as any suit on stage. The energy was there. The people were there. Anyone who told you otherwise wasn’t.
“This conference belongs to the Bitcoin natives. The suits are welcome guests, not the main event.”
The politicians showed up in force too. Acting AG Todd Blanche, FBI Director Kash Patel, SEC Chairman Paul Atkins, CFTC Chairman Mike Selig, Senator Lummis pushing the BITCOIN Act. Unprecedented. But here’s what was telling: the FBI Director’s panel was attended minimally compared to Saylor and Eric Trump. The Bitcoin community was polite about it, but they made clear who they came to see.
We covered the Clarity Act angle in depth with Charles Hoskinson last issue. If you missed it, read the full breakdown here. The short version: the regulatory picture is complicated and the turf wars are getting louder, not quieter, as the CFTC suing Wisconsin this week proved.
On the ground, the conversation that surprised me most was around quantum computing. I sat down with Krown Technologies, the official quantum wallet of Bitcoin 2026, live in the Lambo, and the Q-Day question is no longer theoretical. It’s a when, not an if. And most people’s wallets are nowhere near ready.
Meta launched stablecoin payouts for creators this week, a quiet but significant signal that stablecoins are becoming a payment rail, not just a trading instrument. Jerome Powell delivered his final FOMC press conference as Fed Chair with rates held at 3.50%-3.75% and said the Fed’s independence is “at risk.” US national debt surpassed US GDP for the first time since World War II. Pete Hegseth called Bitcoin a tool to project power. The S&P 500 closed at an all-time high of 7,200 with over $6 trillion added to US markets this month. These macro conditions historically favour hard assets, and the institutional floor under this market has not moved.
XYO Network — The Original DePIN Protocol: Now with Its Own Layer One
10M+ nodes. A decade of proof-of-work. XYO’s Layer One is built for high-volume data, AI infrastructure, and real-world asset tokenization, with dual tokens $XYO and $XL1.
On the Ground at Bitcoin 2026: Hot Topics, Charles Hoskinson & the Clarity Act
Ashton Addison joins Gavin Mehl for a live street interview on the promenade in Las Vegas during Bitcoin 2026. They cover the hottest topics at the conference, key takeaways from the Charles Hoskinson interview and what the Clarity Act means for the industry, plus a BSV chart breakdown.
Is Your Bitcoin Safe from Quantum Attacks? ft. Krown Technologies (Live in the Lambo)
Ashton Addison sits down with Krown Technologies, the official quantum wallet of Bitcoin 2026, live in the Lambo in Las Vegas. They break down how serious the quantum computing threat really is to Bitcoin and crypto wallets, whether people’s coins are safe today, when Q-Day could arrive, and how to prepare your holdings before it does.
Crypto Onboarding is Still Broken. Ramp Network’s CEO Explains How to Fix It.
Przemek Kowalczyk, Co-Founder and CEO of Ramp Network, joins Ashton Addison to break down why buying crypto is still harder than it should be, where users actually drop off, and what it takes to operate a global payments business across 150+ countries. They also cover Ramp’s just-announced multichain wallet and what stablecoins change about the entire on-ramp model.
📊 Market Analysis
BTC
Bitcoin 4H — May 1, 2026
Bitcoin is trading around $77,000 today, up roughly 13% in April and holding above the key $76,200 support level, the 23.6% Fibonacci retracement. The week dipped toward $75,000 mid-conference as oil surged and leveraged positions were flushed out, with over $110M in BTC liquidations accelerating the move. Buyers stepped back in and the structure held. Price is now consolidating in the $76,200 to $79,000 range, pressing up toward the $78,500 resistance zone where sellers have been active.
Bias: CAUTIOUSLY BULLISH. Bitcoin is stronger than ETH right now and the macro environment is improving. Institutional flows remain the floor. ETF inflows are steady and exchange reserves continue to fall as more BTC moves into cold storage. The Iran conflict and oil prices are the main overhang weighing on risk assets, but any easing of those tensions could give BTC a clean run at $80,000.
What I’m watching: A confirmed daily close above $78,500 opens the path toward $80,000 and beyond. Failure to hold $76,200 on a retest risks a move toward $73,500.
ETH is underperforming Bitcoin meaningfully this week. BTC dominance has climbed to 58.1%, capital is rotating into Bitcoin as the defensive play while ETH consolidates. ETH attempted $2,400 twice and was rejected both times. The Ethereum Foundation selling 10,000 ETH to Bitmine for $22.9M is orderly and counter-cyclical by design. Tom Lee’s firm now holds over 5 million ETH as the largest corporate holder, a long-term bullish signal framed correctly. But short-term, ETH needs to find its footing.
Bias: NEUTRAL TO BULLISH, patient. The setup isn’t broken but ETH needs to outperform BTC on a percentage basis before getting aggressive. The $2,300 floor is what matters right now. Hold it and the structure stays intact.
What I’m watching: ETH/BTC ratio for confirmation alts are ready to participate. A clean hold and close above $2,400 with volume changes the picture quickly.
Bitcoin dips under $76,000 mid-week during Bitcoin 2026, recovers. Institutional floor held.
CFTC sues the state of Wisconsin for encroaching on its authority over crypto prediction markets.
Trump family’s World Liberty Financial partnered with a crypto project linked to alleged scam-ring operators sanctioned by the US, per WSJ.
Treasury Secretary Bessent says the US is targeting Iran’s “access to crypto.”
Federal Reserve holds rates at 3.50%-3.75%. Jerome Powell delivers his final FOMC press conference as Fed Chair. Says the Fed’s independence is “at risk.”
Meta launches stablecoin payouts for creators. Major mainstream signal for stablecoin adoption.
Elon Musk says most cryptocurrencies are “scams” during OpenAI court testimony. “Some of them have merit, but most of them are scams.”
US national debt surpasses US GDP for the first time since World War II.
US Secretary of War Pete Hegseth says he is a “long enthusiast” of Bitcoin and agrees it is a tool to project power.
S&P 500 hits new all-time high of 7,200. Over $6 trillion added to the US stock market this month.
Senate unanimously passes resolution banning members from trading on prediction markets.
Ethereum Foundation sells 10,000 ETH for $22.9M to Bitmine. Bitmine now the largest corporate ETH holder at 5M+ ETH.
Citadel receives regulatory approval to operate in Dubai, UAE.
UAE exits OPEC and OPEC+ after 59 years. Macro wildcard. Watch for knock-on effects on oil, dollar, and risk assets.
💬 Closing
Bitcoin 2026 is done. The conference delivered. The FUD merchants were wrong. 30 to 40 thousand people showed up, Saylor sold out his talk, and Afroman drew as big a crowd as any politician on the schedule. The suits came, but this conference still belongs to the Bitcoin community. That’s not a small thing.
The conversations happening on the ground, quantum threats, stablecoin rails, the Clarity Act, institutional accumulation, are the ones that will shape the next cycle. The macro is supportive, BTC is stronger than ETH right now, and the chart is setting up for a move back into the channel.
The S&P at all-time highs with $6 trillion added to markets in April tells you risk appetite is real. That finds its way into crypto. It always does.
Next week we’re at Consensus Miami, May 5-7, doing interviews on the ground. If you’re there, come find us. And remember, next year it’s Nashville, not Vegas.
Watch the $78,500 level on Bitcoin. Everything else is noise until that resolves.
Ashton Addison
CEO, Crypto Coin Show
Heading to Consensus Miami, May 5–7? We’ll be there doing interviews all week.
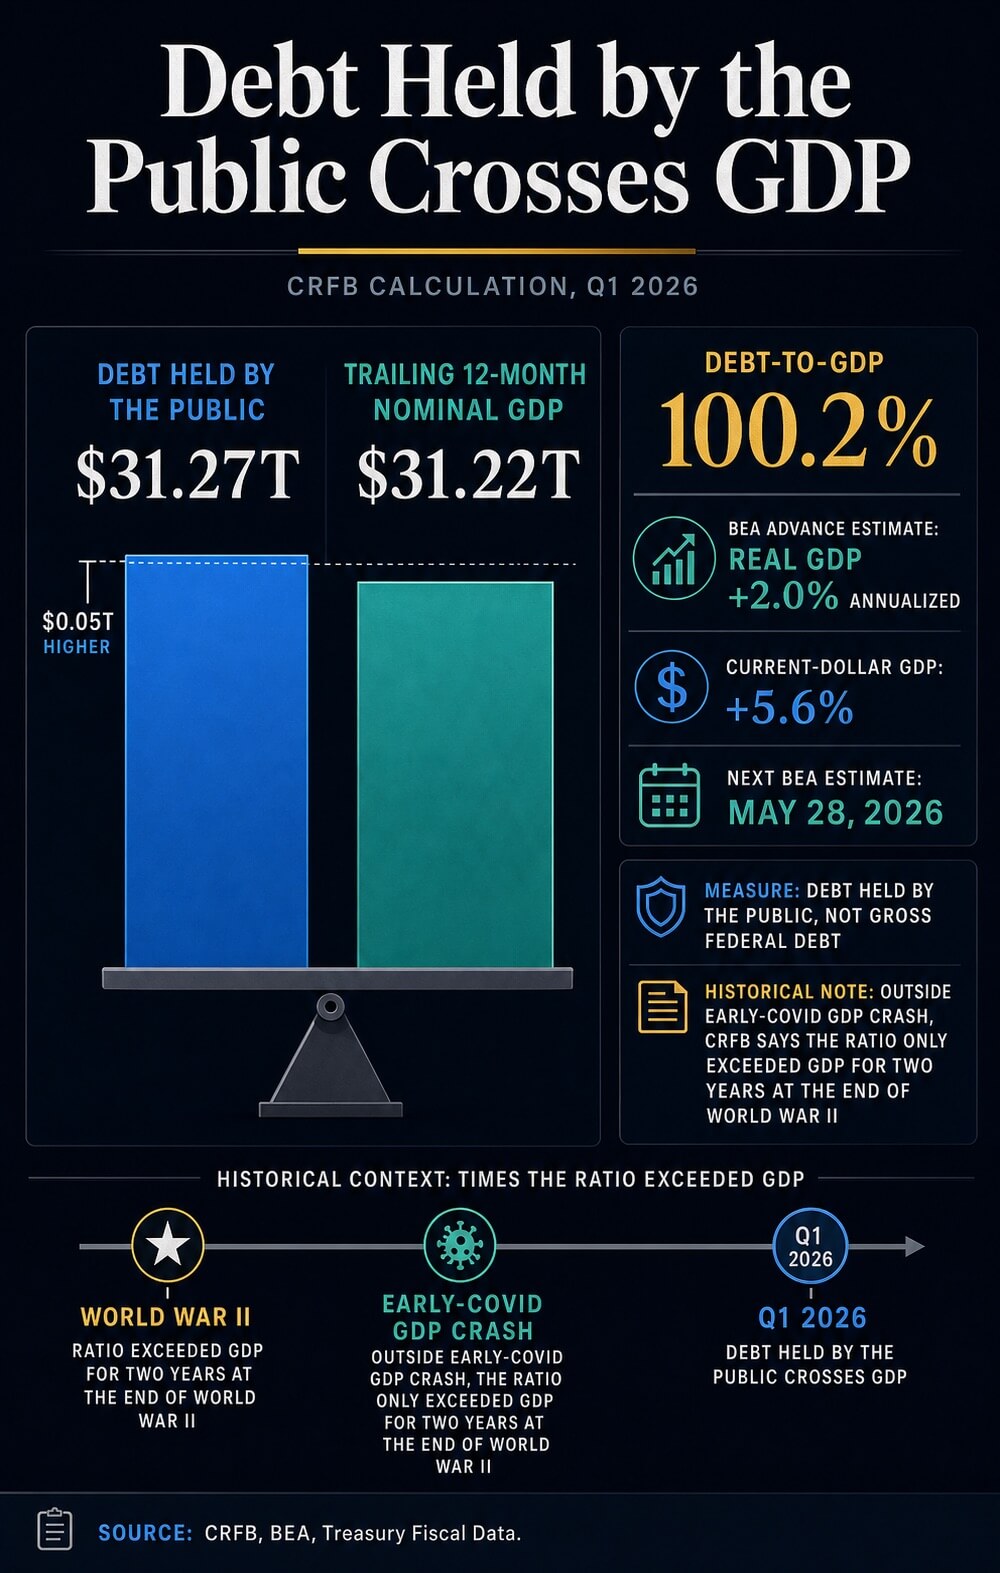
U.S. public debt has crossed the size of the U.S. economy on a calculation from the Committee for a Responsible Federal Budget, giving Bitcoin’s hard-money case a live fiscal benchmark as investors weigh scarce assets against Washington’s debt path.
CRFB said debt held by the public reached $31.27 trillion at the end of the first quarter of 2026, compared with $31.22 trillion of trailing 12-month nominal GDP. That puts the ratio at 100.2%, using the Bureau of Economic Analysis advance estimate for first-quarter output.
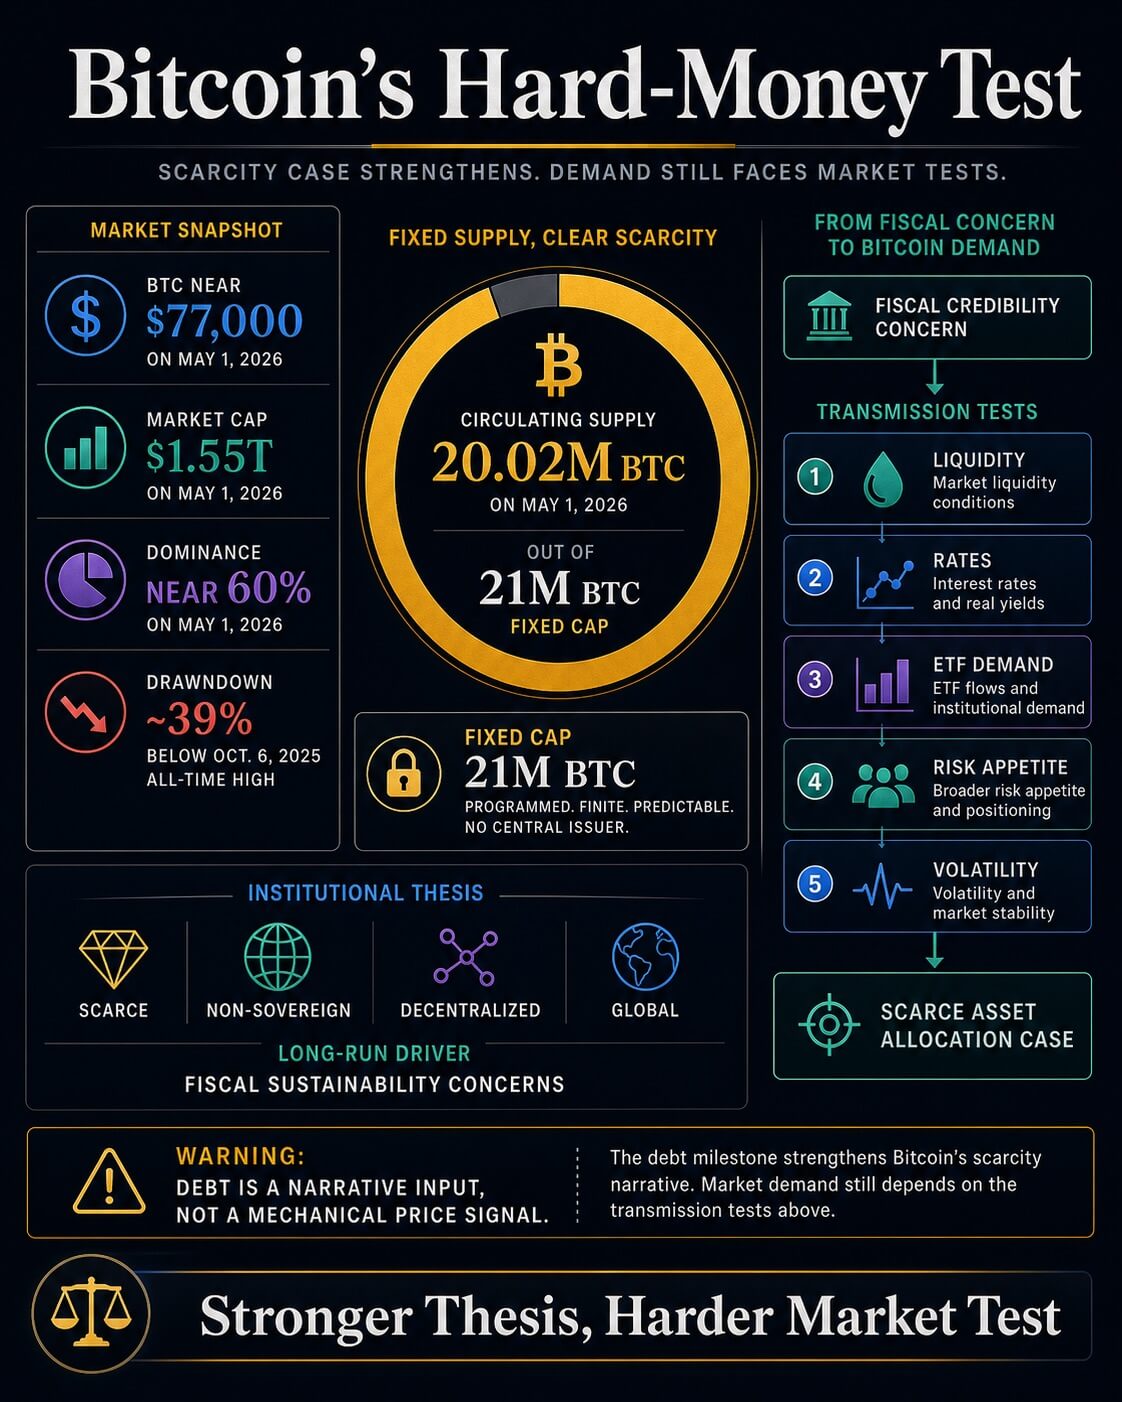
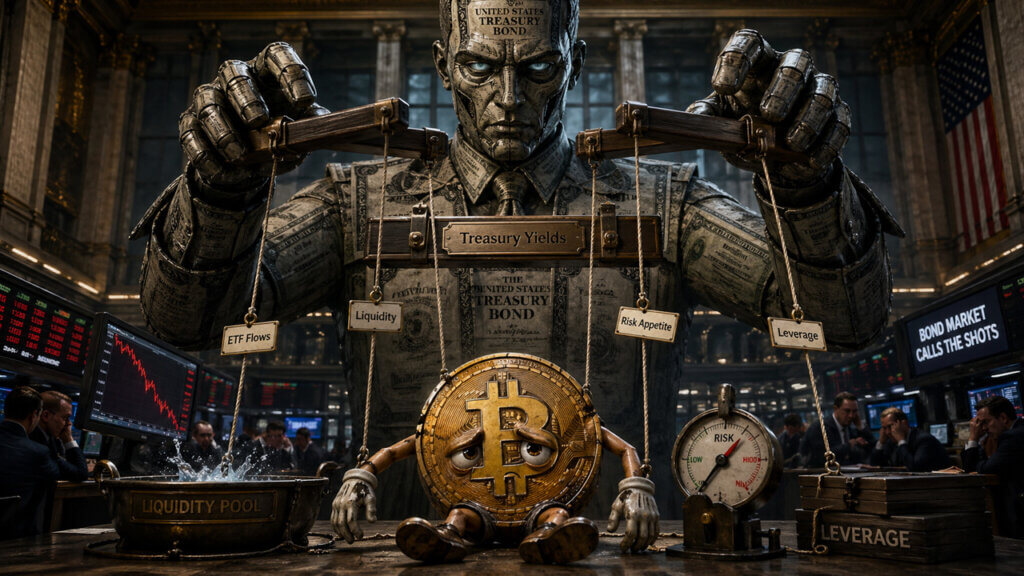
For Bitcoin, the threshold turns an abstract scarcity argument into a current macro question: whether a fixed-supply, non-sovereign asset becomes more attractive when confidence in sovereign balance sheets weakens. Debt is the narrative input. Liquidity, rates, ETF demand, and risk appetite are the transmission mechanism.
The move above 100% of GDP strengthens the case investors can make for Bitcoin as scarce monetary insurance. It still leaves open whether those investors will add exposure while Treasury yields, reserve conditions, and volatility keep setting the price of risk.
What the debt threshold changes
CRFB’s calculation uses debt held by the public, the federal debt owed to outside investors and other non-government holders. That measure carries a different market meaning than total public debt outstanding, which also includes intragovernmental holdings.
That distinction is essential because the Bitcoin comparison works only if the fiscal metric is clear. Treasury’s Debt to the Penny data, including its March 31 API record, separates debt held by the public from intragovernmental holdings and total public debt outstanding.
The peg sits on the public-debt measure, rather than the larger figures often used in political debate.
CRFB also placed the threshold in historical context. Outside the brief early-COVID GDP crash, it said debt only exceeded GDP for two years at the end of World War II.
A debt ratio near wartime extremes changes the language investors use around fiscal credibility, even when the U.S. Treasury market remains the center of global collateral.
The GDP side of the ratio also needs care. BEA’s first-quarter release was an advance estimate.
It showed real GDP rising at a 2.0% annualized pace and current-dollar GDP rising 5.6%, but the next estimate is scheduled for May 28. That means the exact ratio can move.
The fiscal signal is still clear enough for market debate, while the precise denominator remains provisional.
Bitcoin enters this discussion because its supply schedule offers a contrast with fiscal expansion. CryptoSlate’s Bitcoin market page showed about 20.02 million BTC circulating on May 1, 2026, against a maximum supply of 21 million.
That fixed cap is the core monetary contrast with a fiscal system that can issue more debt.
BlackRock has given the institutional version of that argument. In its Bitcoin diversifier paper, the asset manager described Bitcoin as scarce, non-sovereign, decentralized, and global.
It also said long-term adoption could be shaped by concerns over monetary stability, geopolitical stability, U.S. fiscal sustainability, and U.S. political stability.
That fiscal language puts CRFB’s debt marker inside Bitcoin’s investment case. Allocators now have a current U.S. reference point for a thesis that can otherwise sound abstract.
The argument is simple: if sovereign debt keeps growing faster than the economy, a credibly scarce settlement asset earns more attention in the debate over monetary hedges.
CryptoSlate’s broader market dashboard and Bitcoin page show BTC near $77,000 on May 1, with a market cap of around $1.55 trillion, dominance near 60%, and a price roughly 39% below its Oct. 6, 2025, all-time high.
A scarcity asset can still trade like a risk asset when liquidity tightens.
Liquidity still decides the transmission
Recent CryptoSlate coverage shows why the debt milestone has to be separated from near-term price behavior. A debt-and-liquidity analysis argued that U.S. debt growth, Treasury issuance, reserve balances, and bank-credit conditions can tighten the plumbing that moves liquidity into risk assets, even when broad money is expanding.
That view is important for Bitcoin because the asset sits at the intersection of two different trades. In the long run, it can be bought as monetary insurance against fiscal and currency risk.
In the medium term, it still responds to the cost of capital, leverage, ETF flows, and the level of yields available on Treasuries.
A separate CryptoSlate piece on Treasury yields and Bitcoin liquidity made the same point through the rates channel. Higher long-end yields raise the hurdle for assets with no coupon or dividend.
Bitcoin can have a stronger monetary narrative while still facing a tougher comparison against Treasury income.
The result is a two-layer market. The debt-to-GDP break improves the macro setup for Bitcoin.
The funding environment decides whether that setup becomes actual demand. Investors using the milestone as a price signal need evidence from flows, yields, reserves, and volatility before the allocation case becomes more than a narrative upgrade.
Public debt has crossed GDP on CRFB’s calculation, reviving a World War II-era comparison.
The exact ratio can shift as GDP estimates revise.
CBO baseline
Debt held by the public is projected to rise from 101% of GDP in 2026 to 120% in 2036.
Faster nominal GDP growth or policy changes could alter the path.
BlackRock Bitcoin thesis
Fiscal sustainability concerns fit the institutional case for a scarce, non-sovereign asset.
Adoption logic and short-term price behavior remain separate tests.
CryptoSlate market context
BTC still trades with liquidity, yields, ETF demand, and volatility in view.
A debt milestone alone leaves flow confirmation unresolved.
Two paths for the thesis
The Congressional Budget Office’s February outlook keeps the fiscal pressure in view. It projects debt held by the public rising from 101% of GDP in 2026 to 120% in 2036, above the 106% high recorded in 1946.
It also projects wider deficits, with rising net interest costs driving much of the increase.
That path gives Bitcoin’s hard-money thesis a durable macro backdrop. If deficits stay large, interest costs rise, and investors become more sensitive to the supply of Treasuries, demand for assets outside sovereign issuance can grow.
In that scenario, the debt milestone becomes a symbol of the constraint Bitcoin was designed to sit outside.
CBO’s own uncertainty work adds the needed restraint. In a February follow-up on how outcomes could differ from its baseline, CBO said economic and budgetary results could land above or below its central estimate, including under paths with faster nominal GDP growth.
The fiscal trajectory is serious, but it is still a forecast path rather than a settled destination.
CryptoSlate’s prior coverage has been building toward the same test from other angles. A February analysis of the decade-long debt path framed the issue through term premium, dollar vulnerability, and Bitcoin’s hard-asset role.
A November piece measured U.S. debt in BTC terms, showing how quickly fiscal expansion can overwhelm Bitcoin’s issuance schedule. CRFB’s new marker changes the timing: the ratio has crossed the threshold now.
That leaves Bitcoin with two likely outcomes. In the constructive version, inflation cools, reserve conditions improve, Treasury supply becomes easier to absorb, and the debt milestone strengthens the case for a modest allocation to scarce monetary assets.
In the restrictive version, issuance stays heavy, yields remain elevated, and Bitcoin keeps trading as a high-beta liquidity asset despite the stronger long-run narrative.
U.S. public debt crossing GDP gives Bitcoin’s scarcity thesis a sharper macro anchor.
It supports the argument that some investors will keep looking for non-sovereign monetary assets as fiscal ratios worsen. It leaves the harder market proof ahead: whether liquidity, rates, and flows align enough for that thesis to become durable demand rather than another macro slogan.
After a period of relative calm, the OG meme coin, Dogecoin (DOGE), has surged even as other top crypto assets have pulled back from gains.
Interestingly, Santiment revealed Dogecoin whale activity has surged to a six-month high.
DOGE Whales Make Their Move
On-chain data recorded 739 transfers of more than $100,000 in a single day. Among 149 wallets holding at least 100 million DOGE each, total holdings have reached an all-time high of 108.52 billion DOGE, which is worth around $11.6 billion.
This uptick in large transactions comes alongside a 14% increase in Dogecoin’s price over the past 10 days, which Santiment believes “is very likely not just a coincidence.” DOGE briefly touched 11 cents before a mild correction to $0.1091 on Friday.
Crypto analyst Ali Martinez recently flagged one of DOGE’s biggest transaction spikes of the year on April 16 after nearly $800 million moved in 24 hours. He noted that sudden jumps in network activity such as this have historically come before periods of volatility, often reflecting large wallets repositioning. The analyst also highlighted the aggressive accumulation by large holders during the ongoing consolidation phase, which suggested supply is being absorbed.
He said this trend typically indicates the formation of a price floor. With DOGE now trading above $0.1018, a level that has blocked five breakout attempts, he sees $0.1172 as the next target.
Several industry experts share a similar bullish outlook for the meme coin.
Futures Market Heats Up
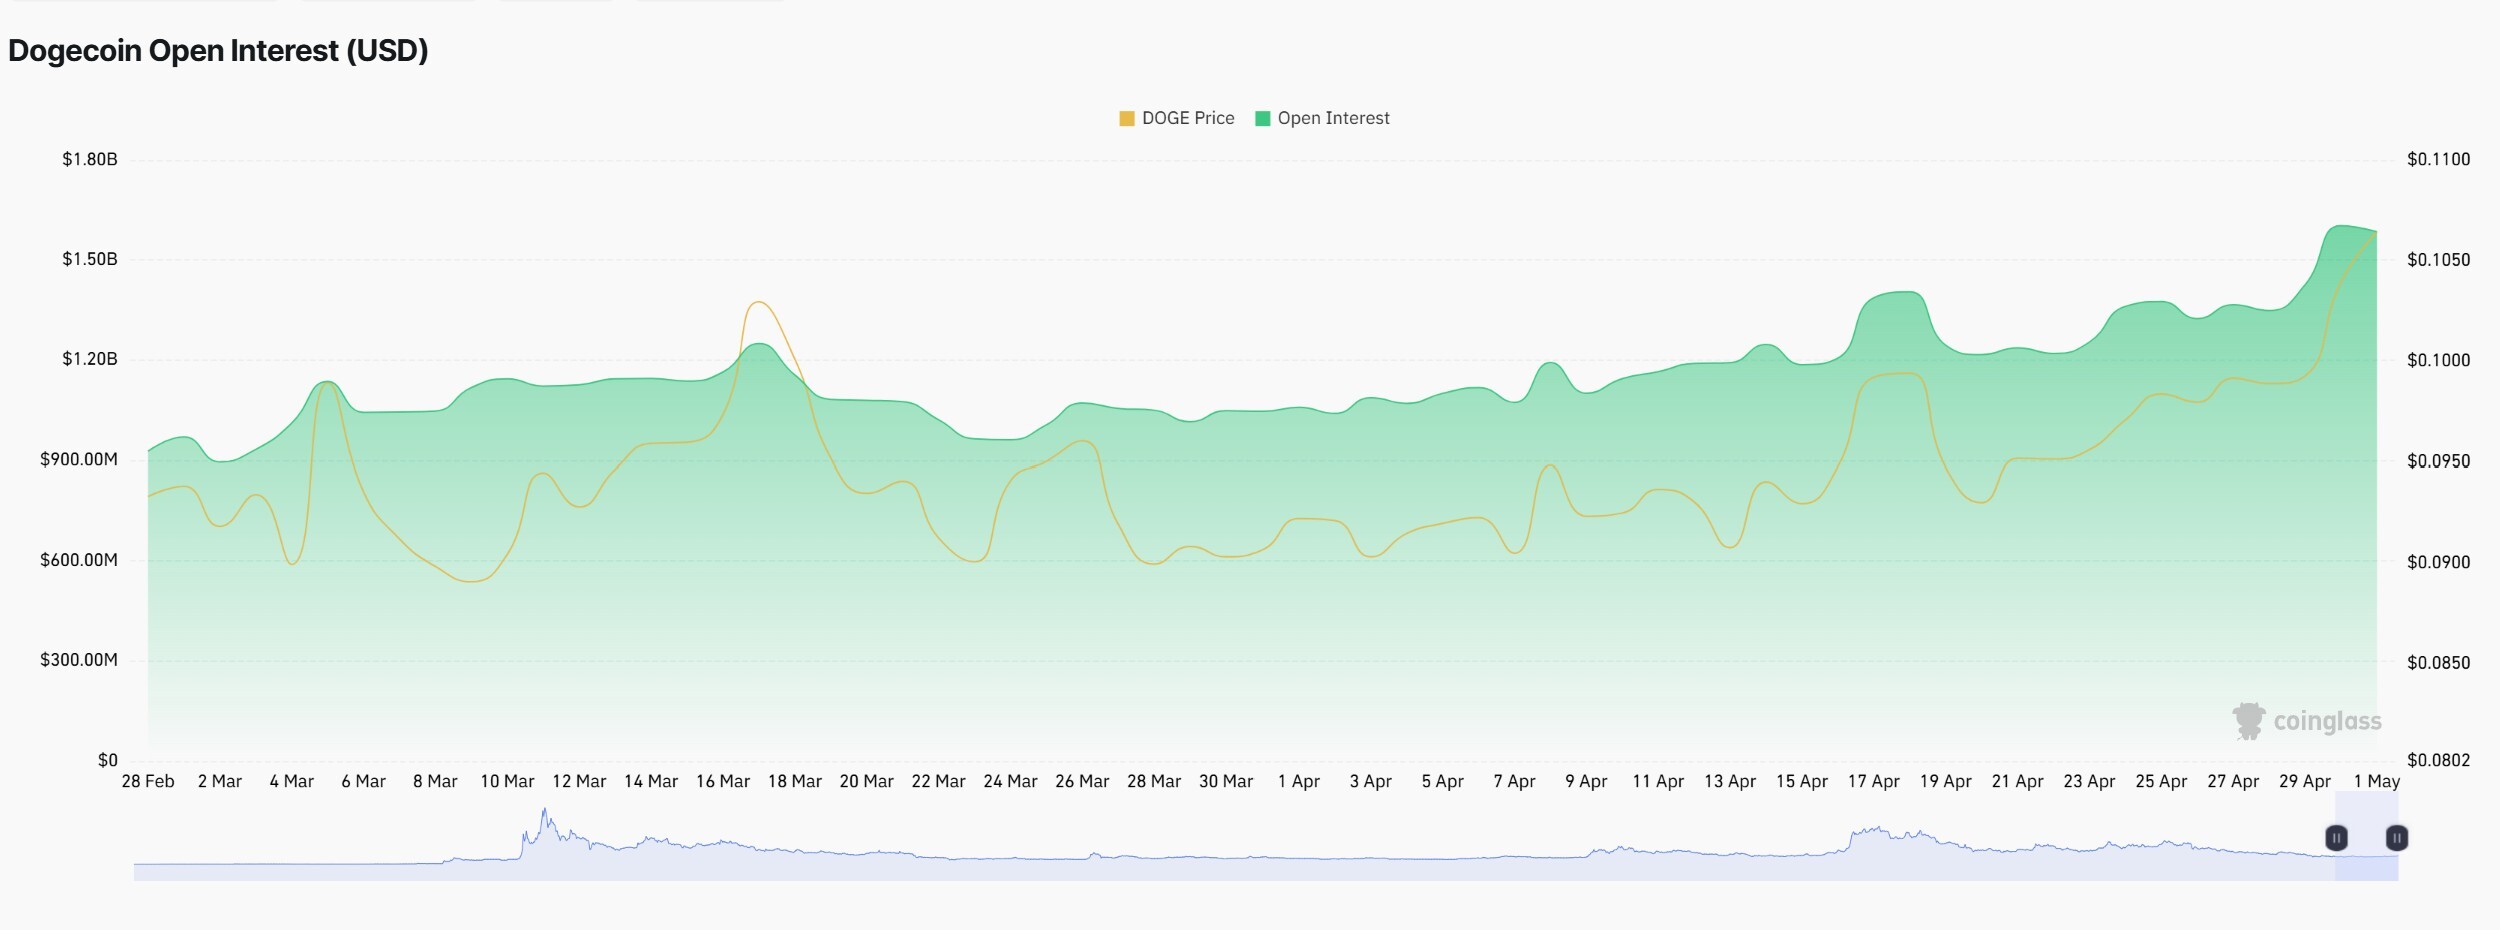
Dogecoin’s futures market has picked up pace as its open interest reached 15.3 billion tokens, as per data compiled by Coinglass.
Dogecoin Open Interest on CoinGlass
Binance dominated DOGE open interest with more than 4 billion, while Gate.io followed at 1.86 billion. Bitget, Bybit, and OKX each hovered near 1.4 billion. Meanwhile, other platforms such as Hyperliquid, MEXC, and KuCoin also held strong positions.
With both price and futures activity climbing, it appears traders are opening new positions rather than just exiting old ones. That usually supports the ongoing upward move in DOGE. At the same time, the build-up of leveraged trades means any change in momentum could trigger quick and sharp pullbacks.
A crypto analyst has shared more insights into the Bitcoin (BTC) price action using a rare Japanese chart pattern called the Renko Mari-Ashi. The chart shows that the Bitcoin price has formed a Double Bottom and could be on the verge of a major breakout. Additionally, it has highlighted the points where the Double Bottom was formed, revealing the area where BTC is likely to start rising again in this cycle.
Bitcoin Double Bottom Formation On The Renko Mari-Ashi Chart
Geometric, a pseudonymous market analyst on X, said on April 28 that the Renko Mari-Ashi chart is signaling another major bottom formation for Bitcoin. He described this chart as a special Japanese chart that focuses solely on a cryptocurrency’s price movement, not the timing of its actions.
He said that this chart was designed to filter out market noise and highlight major trends and reversals in a cryptocurrency. Moreover, unlike traditional candlestick charts, which create a new candle at each interval, the bricks on the Renko Mari-Ashi chart are formed only when the price moves by a specific amount, which can take minutes, hours, or days.
Looking at the Bitcoin price action on this rare chart, Geometric tracks the cryptocurrency’s movements from 2018 to the present, highlighting every major bull run and bear market along the way. The chart shows that Bitcoin has now completed a second Double Bottom formation and could be gearing up for a major reversal.
The first time a similar Double Bottom pattern appeared was around September 2024, a few weeks before BTC’s historic surge to the $100,000 psychological level. Prior to this, Bitcoin had formed a Double Top, setting the stage for its Double Bottom. Once that price floor was confirmed, BTC exploded above $100,000 in 2025, forming another Double Top pattern.
Following the trajectory of the Renko Mari-Ashi chart blocks, Bitcoin crashed below $75,000 around May after hitting $100,000. This massive drop preceded the price reversal that led to the cryptocurrency’s historic all-time high above $126,000 in October 2025. Once this ultimate top was reached, BTC started its current bear market decline, which Geometric says has now led to the formation of a new Double Bottom, similar to the one that emerged in 2024.
Where BTC Bottom Stands And When The Uptrend Begins
The Renko Mari-Ashi officially places BTC’s current Double Bottom around the $60,000 to $65,000 range. The first bottom formed in February 2026 when BTC crashed down toward $60,000, while the second price floor emerged near $65,000 following a bullish fakeout.
With this Double Bottom now confirmed, Geometric suggests that BTC’s bear market may be over, and price action has returned to the green. He wrote on the chart that the Bitcoin price is now in a bullish breakout zone, signaling a potential strong rally ahead. If price action plays out as it did in 2024, BTC could be headed for another major bull run to new highs this cycle.
Ethereum is opening May at around $2.3k, having spent the final week of April consolidating below the $2.4k resistance zone that has now rejected the price on multiple occasions. With the Coinbase Premium Index turning negative precisely as the asset stalled at resistance, the question entering the new month is whether US institutional demand has genuinely returned, or simply made a brief appearance before retreating again.
Ethereum Price Analysis: The Daily Chart
The ascending white channel from the February low remains the dominant structure on the daily chart, with its lower boundary tracking near $2k and continuing to provide the foundation for every pullback since March. The asset is currently sitting just above the 100-day moving average located at approximately $2.2k, which has now turned into a dynamic support.
The RSI has also faded from its mid-April peaks near to roughly 50, mirroring the pattern seen across the broader market as the April recovery momentum runs out of steam.
The structural picture has not broken down, but it has not progressed either. A daily close above the $2.4k supply zone remains the single requirement for the bullish thesis to regain credibility, opening the path toward the critical $2.8k area and the 200-day moving average nearby.
On the downside, the ascending channel’s lower boundary near $2k is the line that matters most, as a close below it would be the first structural damage since the February recovery began, and would bring the $1.8k demand zone back into active consideration.
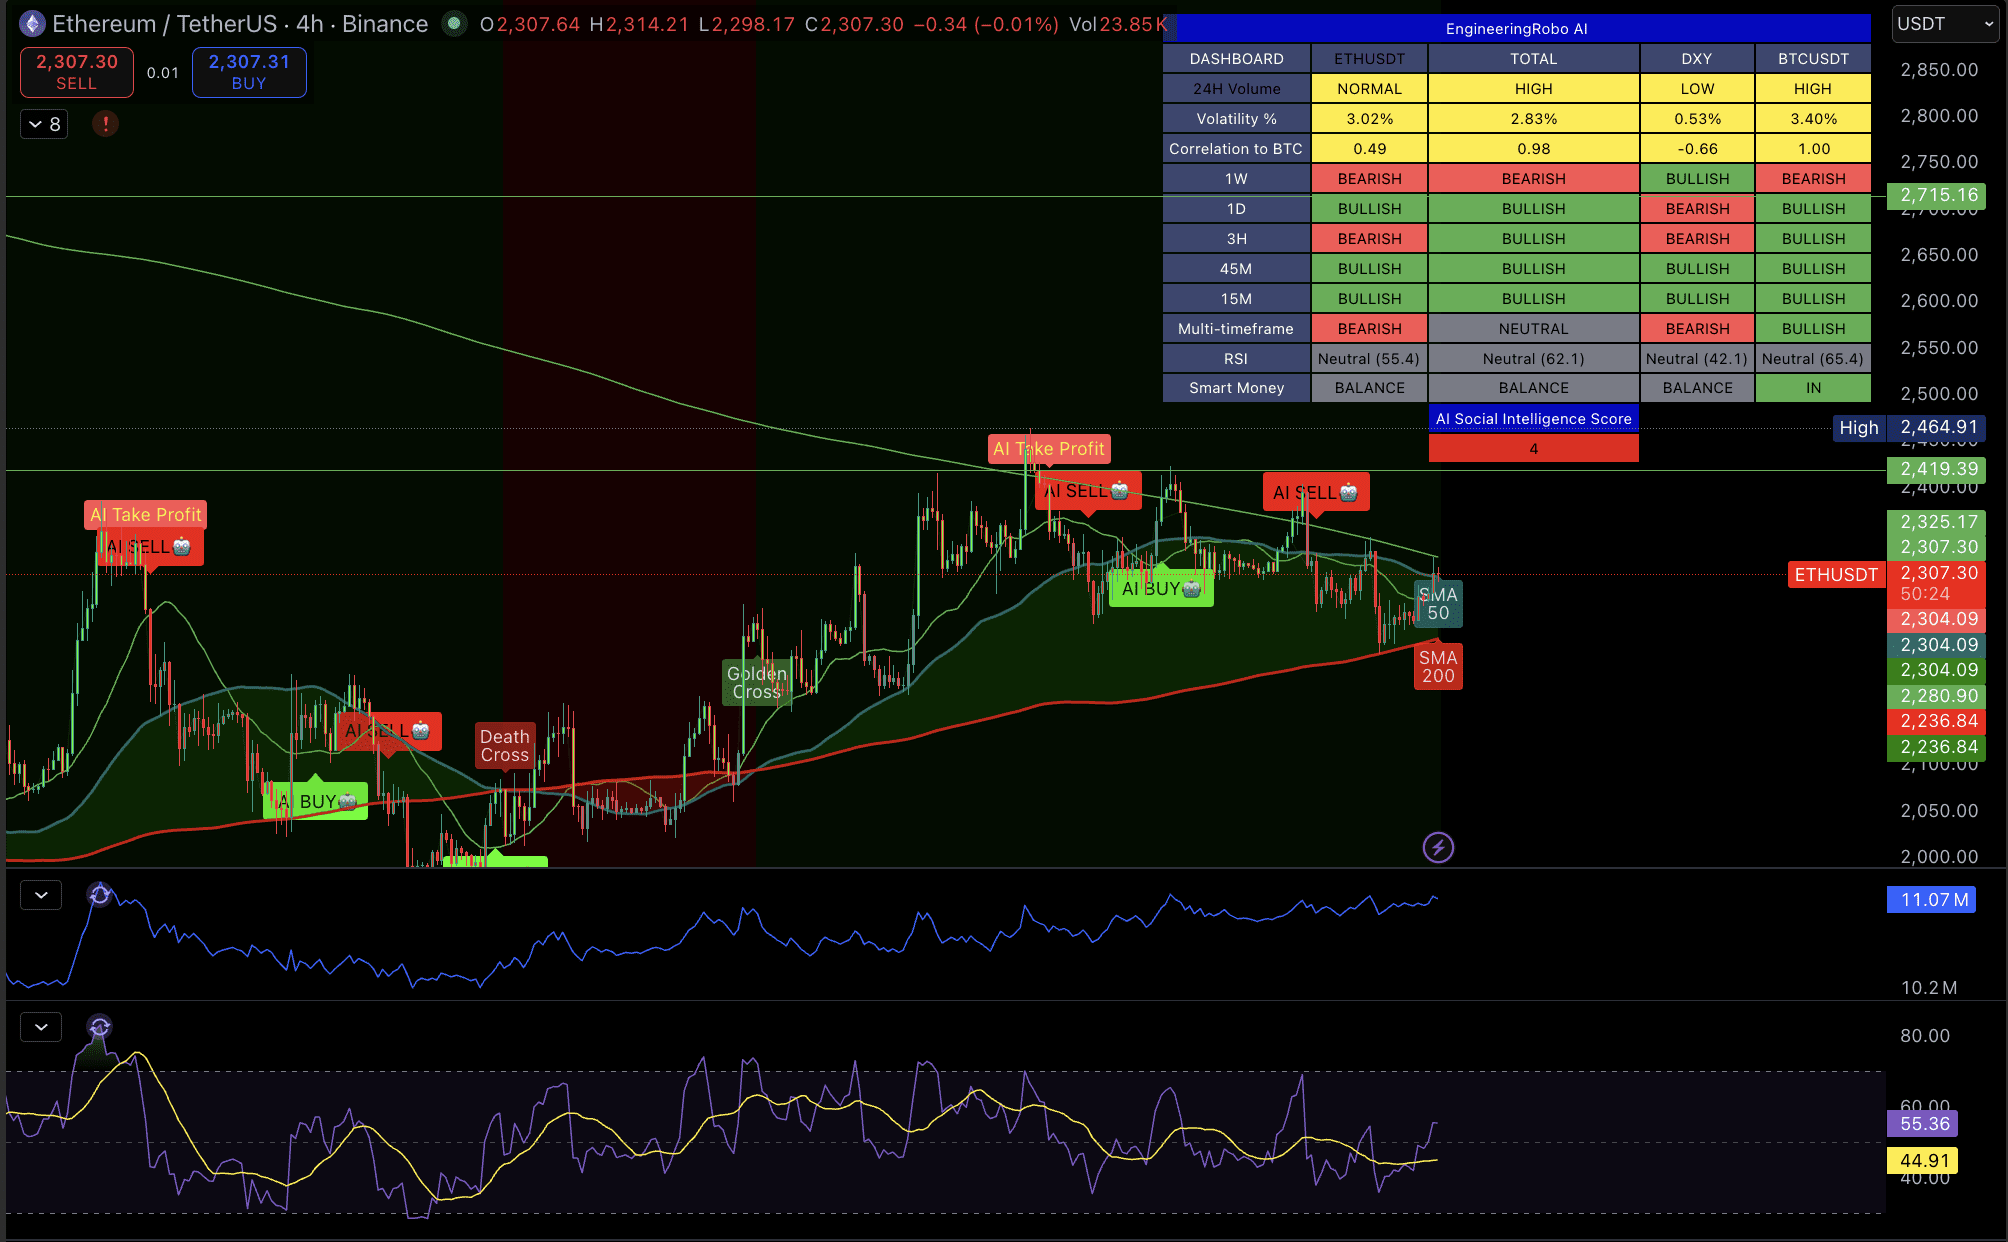
ETH/USDT 4-Hour Chart
The falling wedge that formed after the mid-April peak near $2.4k is now in its final stages of compression, with the converging trendlines squeezing price into a decision zone right at current levels. ETH is sitting near the wedge’s lower boundary after a bounce from it, and the RSI on this timeframe has recovered modestly from its recent lows to 50, which indicates a reset in short-term momentum.
The horizontal support zone at $2.2k sits just below as the next meaningful floor if the wedge breaks to the downside. A clean 4-hour close above the wedge’s upper boundary and through $2.4k would signal that the pattern is resolving bullishly, with the grey arrow projection targeting approximately $2.7-$2.8k as the measured move.
Sentiment Analysis
After spending most of April in positive territory, which was a meaningful shift from the deeply negative readings that accompanied ETH’s collapse below $2k in February, the Coinbase Premium Index has abruptly flipped back to -0.03 as May opens.
The timing is not coincidental. The premium turned positive as price recovered from the lows and US buyers re-engaged, but it has now reversed precisely as ETH stalled at the $2.4k resistance zone again. US institutional demand appeared at the lows and faded at resistance, which suggests a market being accumulated cautiously, not one where conviction buyers are stepping in to force a breakout.
The broader context amplifies this reading. US investors are navigating a difficult macro environment entering May, with ongoing tariff policy uncertainty, the Federal Reserve maintaining a restrictive stance, and equity markets exhibiting the kind of intermittent volatility that historically drives institutional capital away from high-beta risk assets like ETH.
The current premium reading of -0.03 is far from the extreme negativity of February’s -0.20 lows, and a return to positive territory is entirely possible if the macro backdrop stabilizes, which could lead to a breakout above $2.4k and a more profound recovery in the coming weeks.


 Whales Quietly Accumulate as Holdings Hit Record Levels")